
 Home
Home News
News

- 1 Vechain price (VET) is down by 0.48% in the last 24 hours and is currently trading at $20.016.
- 2 Vechain price (VET) is declining in a channel pattern after a surge of 37% in June thus eroding all the gains.
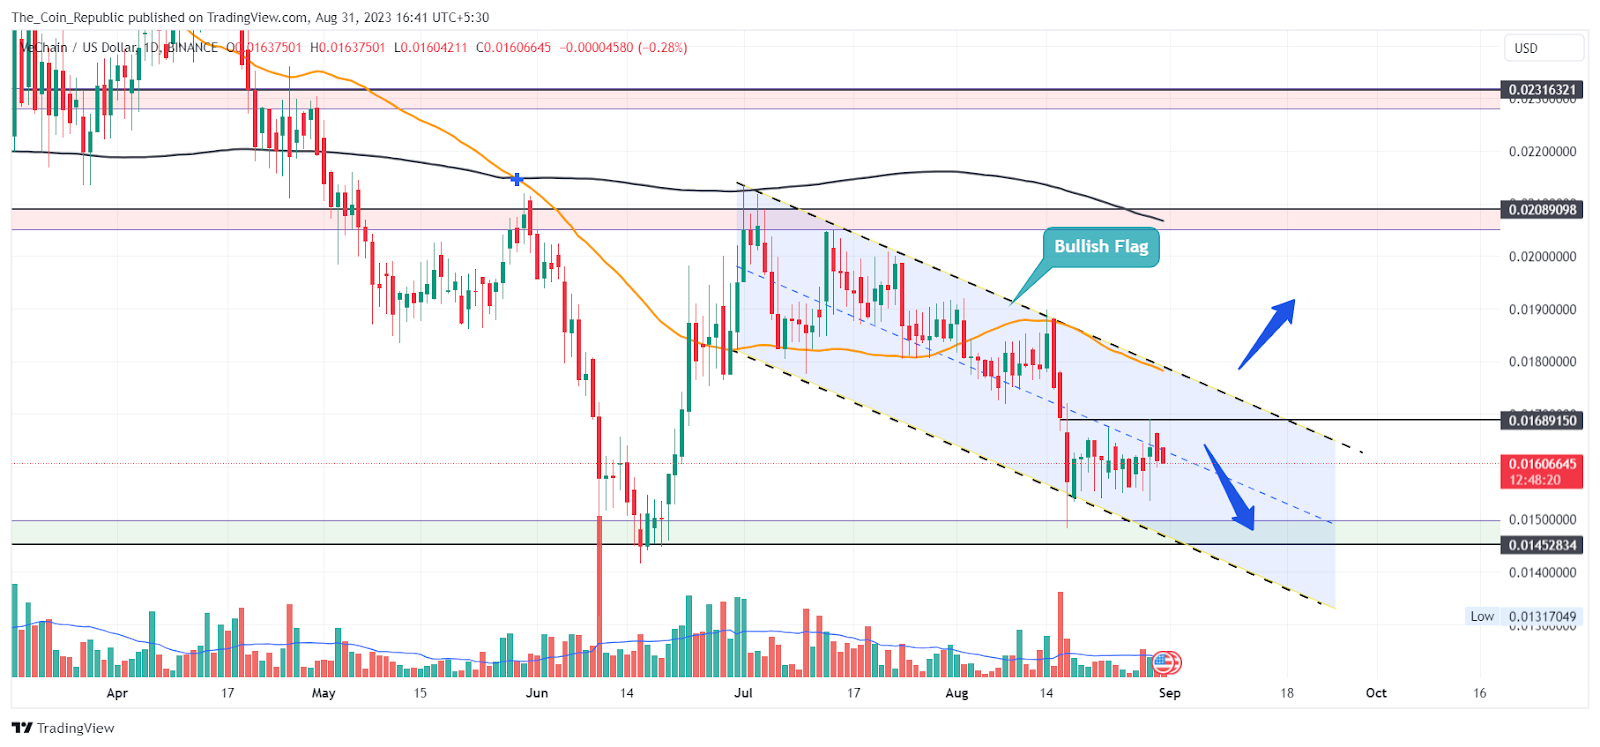
The VET price has been in a continuous declining trend eroding all the gains. The price surged nearly 37% from the swing low to recover from the decline. However, the price could not accumulate enough buyers to surpass the swing high. The sellers dominated at the top and dragged the price down.

Thereafter, the price declined to form a bullish flag pattern as observed on the daily chart. The price could not sustain above the key moving averages and slipped down indicating the aggressive selling pressure in the market.

Vechain (VET) is an ecosystem that uses IoT and distributed governance to solve data challenges for various industries such as medicine, energy, food & beverage, and sustainability. VeChain enables real-time and trustless data sharing among many participants which is essential for the fourth industrial revolution.
Vechain Price Prediction Using Price Action Strategy
Currently, the VET price is nearing the previous swing low from where buyers might try to halt the downward momentum and turn the table. The breakout of the channel may give some hope for buyers to take aggressive positions in the crypto.
However, if the price does not encounter more buying volume at the recent support it may decline more to form a new swing low. The overall trend might be bearish until the price remains in the channel and continues to decline.
Also, the volume analysis shows that the volume received is less than the average volume indicating the weakness in the market. The VET token has received a $20.8 Million volume in the past 24 hours which is nearly 29.39% less than the past day.
VET Price Forecast from Indicators’ point of view

As per the EMA analysis, the VET price could not sustain above the 50 and 200 EMA indicating the dominance of sellers over the daily chart.
RSI has made a positive crossover of the SMA line which might signal some positive move in the price. However, the RSI is still below the mean line which shows bearishness dominating the charts.
Conclusion
The VET price is in a downtrend, and forming a bullish flag pattern after a price hike of 37% in June 2023, on the daily chart. The price failed to break the swing high and fell below the key moving averages. The price is near the previous swing low, where buyers may try to halt the decline and accumulate to surge the price and break out of the channel. The failure of this may result in a price drop and make a new low. The volume is low, showing weakness in the market. The VET token has $20.8 Million volume in the last 24 hours, 29.39% less than the previous day.
Technical Levels
- Support levels: $0.014 and $.011.
- Resistance levels: $0.020 and $0.024.
Disclaimer
The views and opinions stated by the author, or any people named in this article, are for informational purposes only and do not establish financial, investment, or other advice. Investing in or trading crypto or stock comes with a risk of financial loss.

With a background in journalism, Ritika Sharma has worked with many reputed media firms focusing on general news such as politics and crime. She joined The Coin Republic as a reporter for crypto, and found a great passion for cryptocurrency, Web3, NFTs and other digital assets. She spends a lot of time researching and delving deeper into these concepts around the clock, and is a strong advocate for women in STEM.


