
 Home
Home News
News
- 1 The Tron crypto’s price increased by 0.20% over the last week and it is trading below all major EMA’s.
- 2 The price of the TRX crypto is trading at $0.077101 and the 52-week range is $0.045255 – $0.094500.
Tron crypto surged by 0.80% in market value and surged by 22.99% in trading volume in the last 24 hours, as per the Coinmarketcap, TRXap a crypto data analysis website. Its market value is $6,874,522,899 and its trading volume is $203,489,792. There are 89,322,534,090 TRX in circulation. The TRX crypto has not performed well in the last month, decreasing by 2.25% and by 15.55% in the last six months. Tron (BITFINEX: TRX) crypto has a positive year-to-date return of 40.97% and a positive one-year return of 41.19%.
TRX Crypto Price Technical Analysis in the 1-Day Timeframe
TRX crypto price showed an upward trend for the past six months, increasing by 15.55% during this period and the price rose by making higher lows and highs.

At the time of publication, the TRX crypto price was trading at $0.076981 and took support from the trendline and rising. the price stepped up from 78.60%, 61.80%, 50.00%, and 38.20% Fibo levels very effectively and spent a decent amount of time as well.
Therefore, if it fails to maintain the current level, the TRX crypto price could continue to move downwards and reach the nearest support at $0.068178 and $0.063393.
However, if the TRX crypto price sustains the current level and rises, then it might hit the nearest resistance levels of $0.086361 and $0.092422.
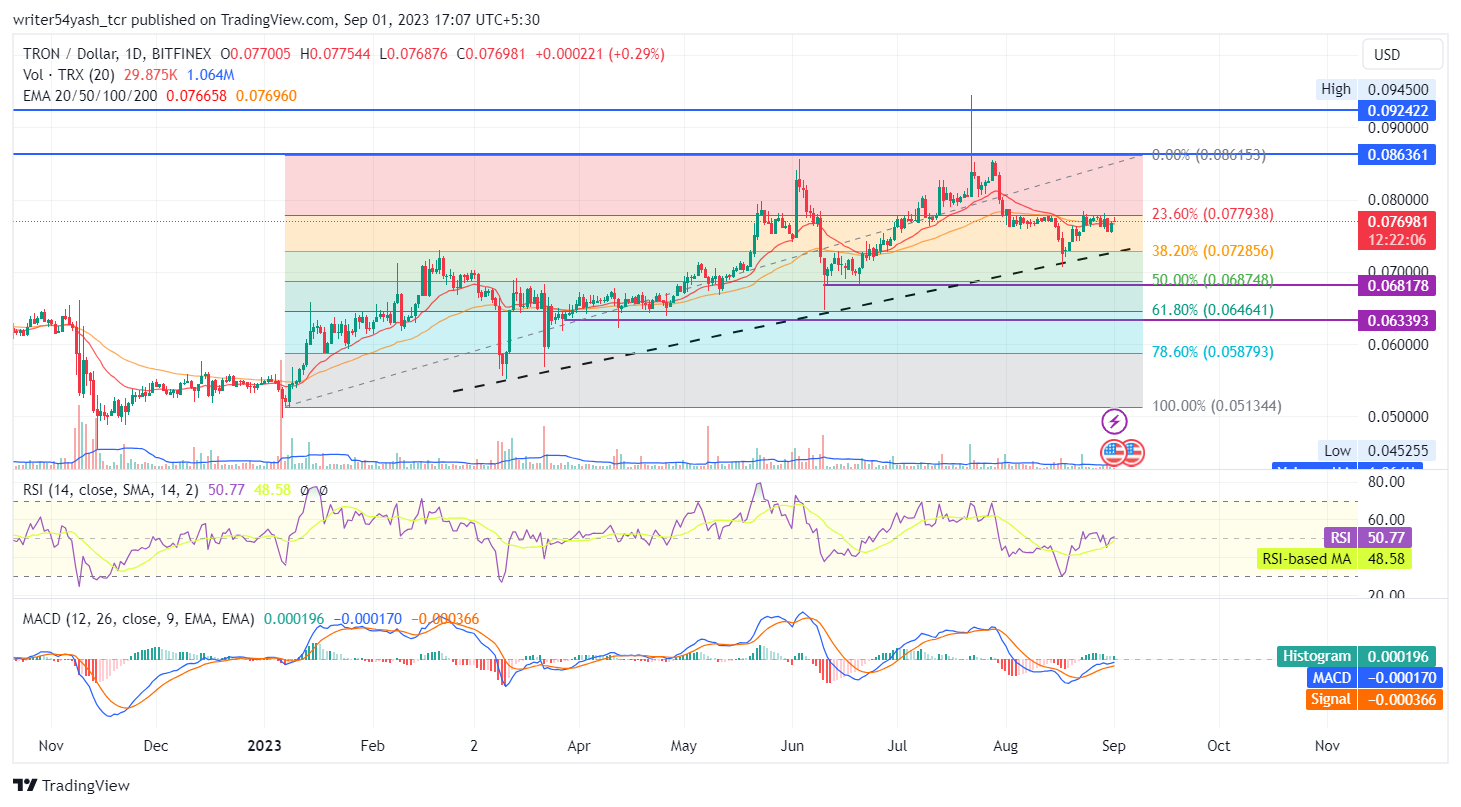
At the time of publishing, the TRX crypto price (BITFINEX: TRX) is trading below the 20, and 50-day EMAs (exponential moving averages), which are rejecting the TRX crypto price trend.
The MACD line at 0.000170 and the signal line at 0.000366 are below the zero line and both lines cross multiple times on each other and each time, the histogram gap is decreased even further highlighting consolidation in TRX price in the MACD oscillator. The current value of the RSI is 50.77 points and the 14-day SMA is below the median line at 48.58 points, which indicates neutral sentiments as the RSI is at the median line in the market for the TRX crypto and highlighting neutrality.
Conclusion
TRX crypto price prediction highlights the neutral sentiments and perspectives of investors and traders regarding TRX crypto in the daily time frame. Tron price action suggests a no view at the time of publishing. Moreover, the technical parameters of the Tron price suggest the continuation of the consolidation over the daily time frame chart. Major reliable indicators RSI, MACD, and EMA, give neutral signals regarding the TRX crypto price.
Technical Levels:
- Support levels: The nearest support levels are $0.06817 and $0.06339.
- Resistance levels: The nearest resistance levels are $0.08636 and $0.09242.
Disclaimer
In this article, the views and opinions stated by the author, or any people named are for informational purposes only, and they don’t establish the investment, financial, or any other advice. Trading or investing in cryptocurrency assets comes with a risk of financial loss.

Nancy J. Allen is a crypto enthusiast, with a major in macroeconomics and minor in business statistics. She believes that cryptocurrencies inspire people to be their own banks, and step aside from traditional monetary exchange systems. She is also intrigued by blockchain technology and its functioning. She frequently researches, and posts content on the top altcoins, their theoretical working principles and technical price predictions.


