
 Home
Home News
News

- 1 United Parcel Service stock is currently trading at $169.40 with a drop of -1.52% and a market cap of 144.884 Billion.
- 2 UPS stock price faced bearish dominance and gave a negative return of -9.34% this month.
- 3 UPS stock is trading in a triangle on the weekly time frame.
UPS stock price forecast showcases that the stock price is trading in a downward trend and might give a breakdown if it breaks some key support. This year UPS’s performance was poor. Since the beginning of the year, the company has given a return of -2.79% to its investors and the returns were the same the whole year indicating price is range bound.
UPS stock price is trading at $169 with a trading volume of 3.55 Million and the average trading volume of the last 10 days being 2.766. The current market cap of the company is 144.884 Billion with a price-to-earnings ratio is 14.91. The floating share value is 732.056 Million with a basic EPS of 11.57.

The Q2 2023 earnings of the company gave a revenue of 22.00 Billion and a net income of 2.08 Million with a profit margin of 9.46%. However, the profit margin of the stock was improved than the Q1 2023 earnings.
As per TradingView, out of 26 indicators,14 are on the sell side, 10 are on the neutral side, and 2 of them indicate a buy signal. However, the overall weightage of indicators is on the sell side.
Furthermore, 26 analysts gave a maximum estimation of a price of 230 and a minimum estimation of a price of 100.00. Moreover, out of 30 analysts, 12 are giving a strong buy signal, 2 are giving a buy rating 14 are hinting at a hold and 2 hinting at a strong sell.
UPS Stock: Will UPS Stock Price Break The Support Level of $166?
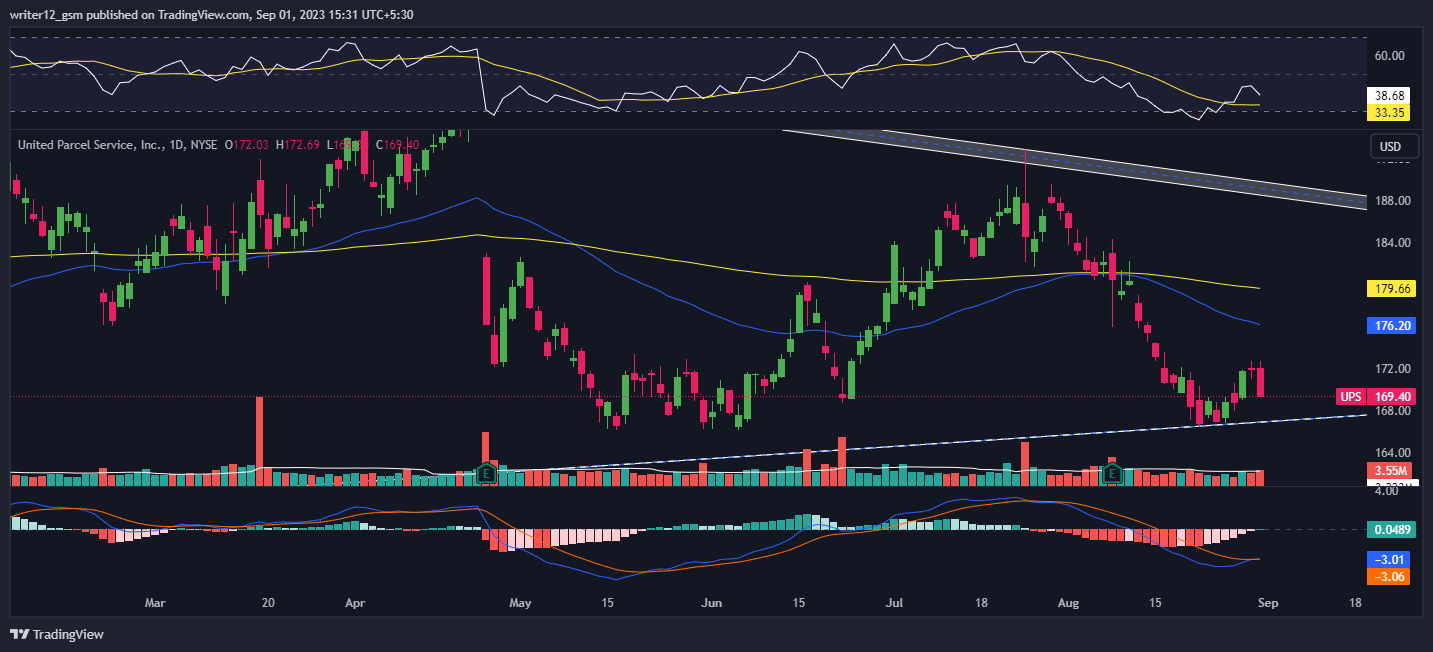
According to the technical chart, UPS stock price took a sharp rejection from the upper trendline of $ and broke the 50 and 200 EMA lines. Moreover, the price was currently heading toward the lower trendline of $166. If the price breaks the lower level of $166, then UPS stock price might witness new lower levels.
The RSI line is also heading towards an oversold zone, breaching the median line. RSI line (38.68) is beneath the 14 SMA (33.35) line demonstrating bearishness. MACD breached the middle line and traded downwards. MACD line (-3.01) is beneath the signal line (-3.06) demonstrating bearishness in the stock.
Symmetrical Triangle On Weekly Time Frame
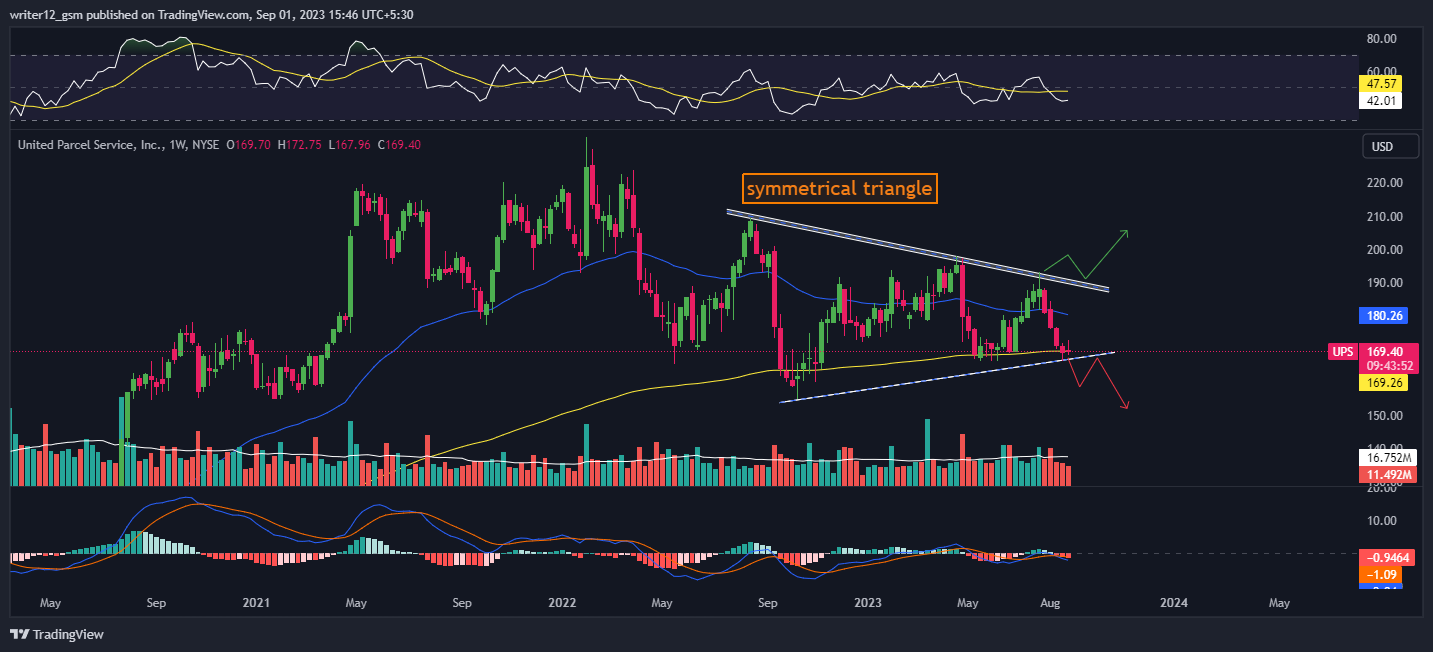
On the weekly charts, United Parcel Service stock is trading in a symmetrical triangle, which probably gives a breakdown. Breakdown registers when the price trades below $166. However, buyers are accumulating the stock by defending it from the support of $166.
RSI shows sellers’ presence. The RSI curve is floating near 42, which indicates that the stock is close to the oversold zone. This could be a sign that buyers are losing control of the stock. However, the RSI is still in the neutral zone, so it is too early to say for sure that a breakdown is imminent.
MACD shows bearish momentum. The MACD indicator is bearish and maintains red bars on the histogram. This suggests that the momentum in the stock is bearish. However, the MACD is not in the oversold zone yet, so it is possible that the stock could stage a rally before breaking down.
Conclusion
United Parcel Service stock price is heading downward breaking 50 EMA and 200 EMA. Most trustworthy technical indicators like MACD and RSI are indicating a downtrend in UPS stock price. United Parcel Service investors should avoid the FOMO (fear of missing out). Scarcity is created in the stock market for accumulating more investors and creditors. It is better to keep it at arm’s length as this may result in one of the emerging reasons for market volatility.
Technical Levels
- Support levels: $155.11 and $166.00.
- Resistance levels: $178.82 and $185.90.
Disclaimer
The analysis provided in this article is for informational and educational purposes only. Do not rely on this information as financial, investment, or trading advice. Investing and trading in stock involves risk. Please assess your situation and risk tolerance before making any investment decisions.
Steve Anderson is an Australian crypto enthusiast. He is a specialist in management and trading for over 5 years. Steve has worked as a crypto trader, he loves learning about decentralisation, understanding the true potential of the blockchain.


