
 Home
Home News
News

- 1 Ethereum price prediction showcases that ETH crypto is in a make-or-break situation inside an interesting pattern.
- 2 ETH crypto has slipped below the 20, 50, 100, and 200-day daily moving average.
- 3 Ethereum cryptocurrency has gained 36.86% year to date.
The Ethereum price prediction underscores the critical juncture at which ETH cryptocurrency currently finds itself, operating within a pivotal make-or-break scenario contained within an intriguing symmetrical triangle pattern. Ethereum has remained confined within this symmetrical triangle pattern, repeatedly attempting to break out but facing failure on multiple occasions. As of now, Ethereum’s price is navigating a crucial crossroads, approaching the lower trendline of the symmetrical triangle pattern on the daily time frame chart.

This presents a pivotal moment for Ethereum, as the decision it makes in this situation will likely dictate the direction of its future price movements. Traders and investors are keenly observing this pattern to determine whether Ethereum will break out of its constraints and embark on a significant price trajectory or continue to trade within the confines of the symmetrical triangle. The outcome of this make-or-break scenario will be instrumental in shaping Ethereum’s short-term and potentially long-term performance.

Ethereum price was at $1635.81 and lost 0.06% of its market capitalization during the day’s trading session. Trading volume has decreased by 53.48% during the intraday trading session. This demonstrates that sellers are trying for a pullback of ETH, the second largest cryptocurrency after Bitcoin. The volume to market cap ratio was 1.40%.
Analyzing Technical Indications For Ethereum Price
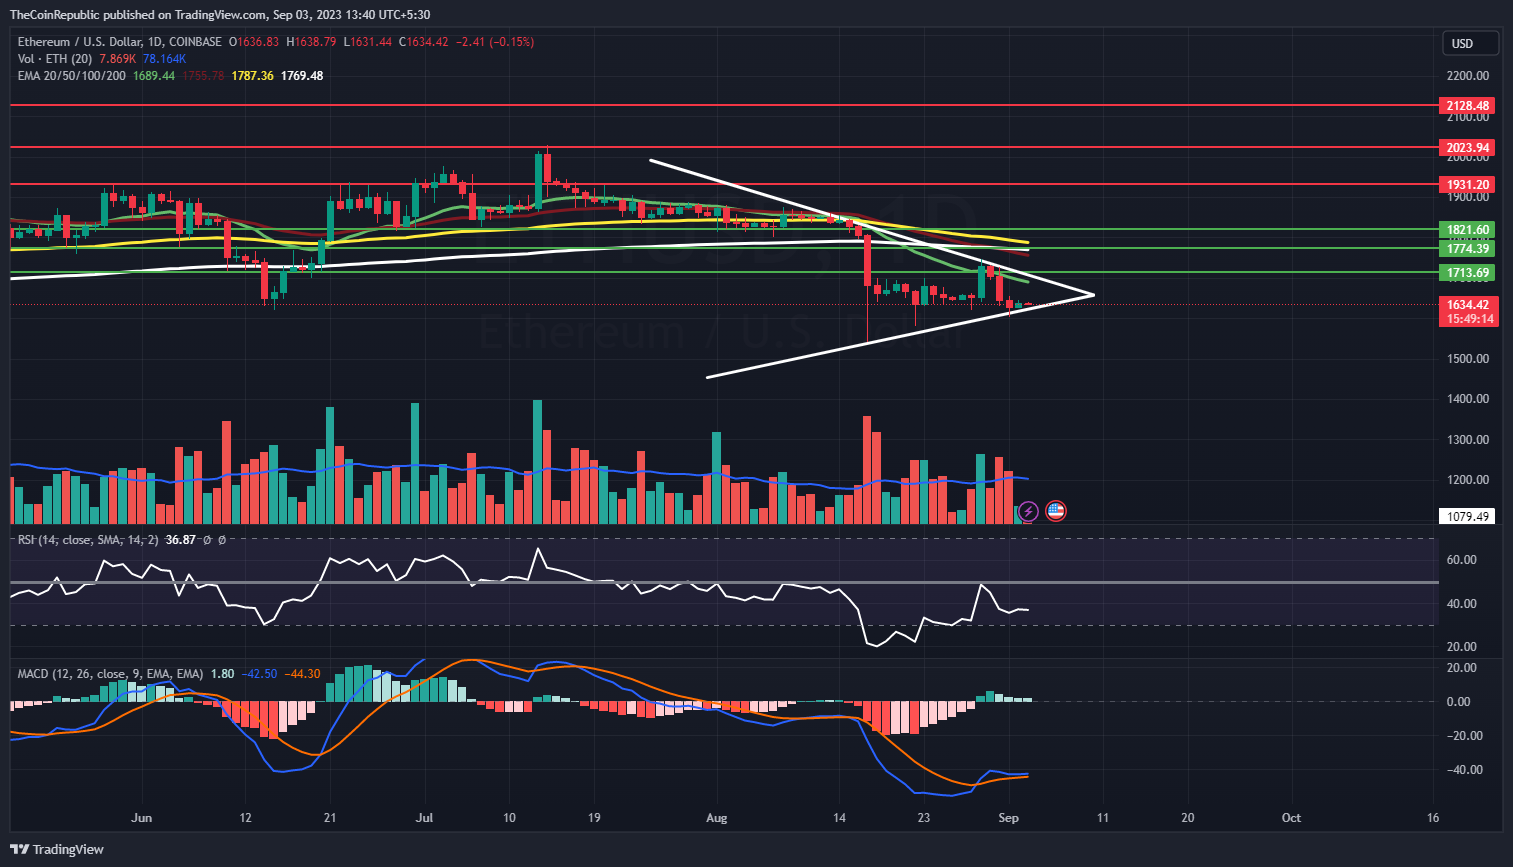
Ethereum price forecast shows the struggle of ETH crypto in breaking out from the symmetrical triangle pattern over the daily time frame chart. Meanwhile, Ethereum cryptocurrency needs to accumulate buyers in order to register its breakout. However, volume change can be seen below average and needs to grow during the day’s trading session. Nevertheless, ETH crypto has slipped below the 20, 50, 100, and 200-day daily moving average.
In order for ETH cryptocurrency to break out of its consolidation phase within the symmetrical triangle pattern and reach a recovery level of $1820, it needs to attract potential buyers. Notably, ETH crypto saw a modest decrease of 0.63% in the past week but also experienced a more substantial decline of approximately 10.82% over the past month.
Zooming out to a longer timeframe, Ethereum cryptocurrency has faced a notable setback, with a decline of 13.46% over the last three months, although it has managed a noteworthy upturn of 4.47% within the past six months. Furthermore, in the current year, ETH’s price has showcased a remarkable recovery, surging by around 36.86%. This highlights the significant progress the cryptocurrency has made on its path to recovery throughout 2023.
Taking into account technical indicators, ETH cryptocurrency faces hurdles as it approaches the lower trendline. The relative strength index suggests that ETH crypto is presently consolidating at its current level. Moreover, the moving average convergence divergence indicates a downward trend in the price of ETH.
The RSI stands at 36 and maintains a stable position, signifying a neutral position below the neutral threshold. Additionally, the MACD line currently overlaps with the signal line, awaiting the potential occurrence of a crossover. Consequently, investors engaged in ETH cryptocurrency should practice patience and closely monitor the daily chart for any significant shifts in direction.
Summary
The Ethereum price prediction underscores the critical juncture at which ETH cryptocurrency currently finds itself, operating within a pivotal make-or-break scenario contained within an intriguing symmetrical triangle pattern. However, volume change can be seen below average and needs to grow during the day’s trading session. Taking into account technical indicators, ETH cryptocurrency faces hurdles as it approaches the lower trendline.
Technical Levels
Support Levels: $1620.95 and $1600.00
Resistance Levels: $1655.00 and $1675.00
Disclaimer
The views and opinions stated by the author, or any people named in this article, are for informational purposes only, and they do not establish financial, investment, or other advice. Investing in or trading crypto or stock comes with a risk of financial loss.

Nancy J. Allen is a crypto enthusiast, with a major in macroeconomics and minor in business statistics. She believes that cryptocurrencies inspire people to be their own banks, and step aside from traditional monetary exchange systems. She is also intrigued by blockchain technology and its functioning. She frequently researches, and posts content on the top altcoins, their theoretical working principles and technical price predictions.


