
 Home
Home News
News
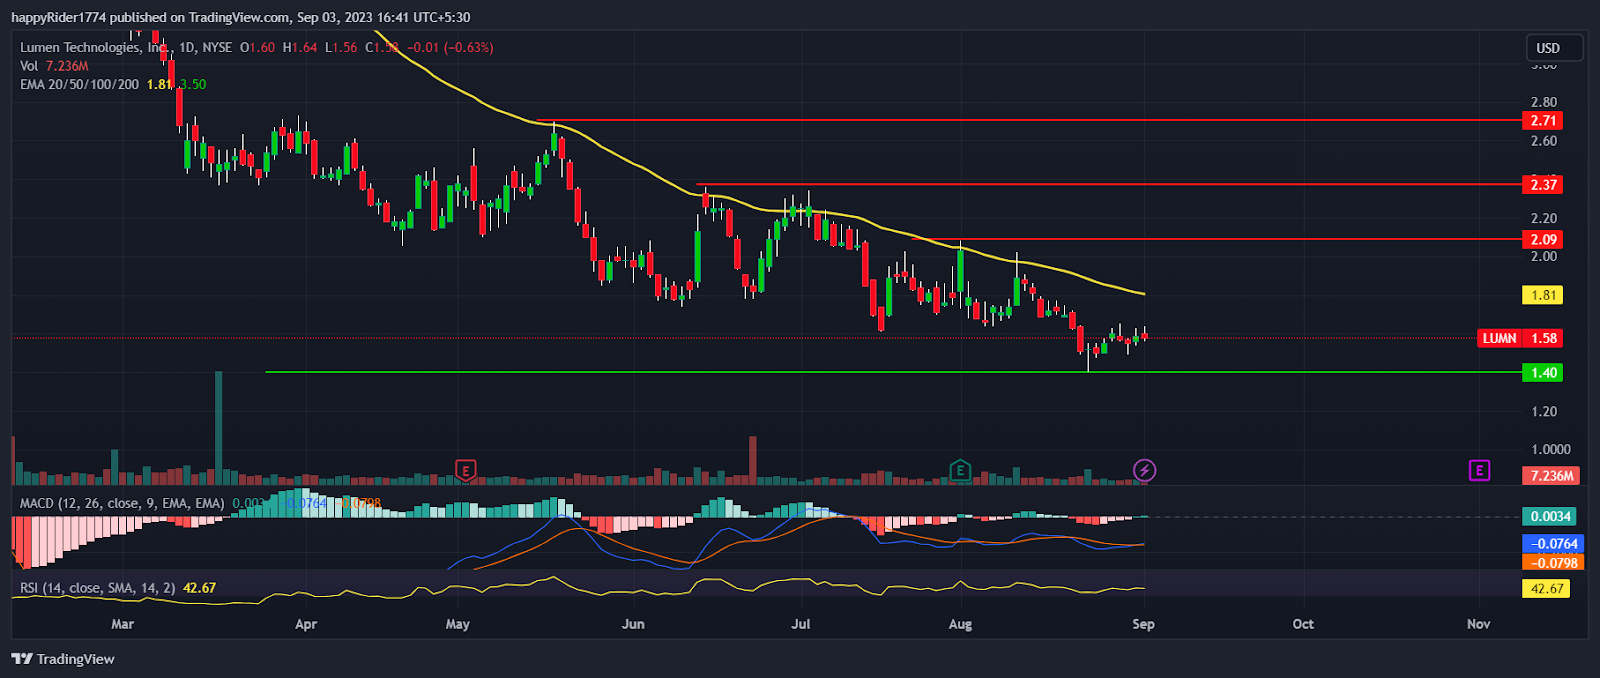
- 1 Lumen stock price (NYSE: LUMN) fell 11% (approx.) in August 2023.
- 2 LUMN stock price is in a strong downtrend and trading below both the EMAs.
- 3 Lumen Technologies Inc. stock struggles to defend the $1.50 support.
Lumen Technologies Inc., LUMN stock price fell around 11% in the previous month and hit a 52-week low at $1.40. Lumen stock price continuously declines by forming lower low swings showing the dominance of sellers.
Lumen stock price is in a strong downtrend and short-term pullbacks are facing rejection from the higher levels. It indicates that short sellers are active and building fresh shorts on every rise.
LUMN stock price had tried multiple times to break out of the 50-day EMA. But, unfortunately, it got rejected and prices again reverted in a downward direction.
Lumen Technologies Inc. (NYSE: LUMN) released the previous quarter earnings on August 1, 2023. It reported an EPS of 0.10 and revenue of $3.661 Billion. The company beat the EPS estimate by 30.21%.
Due to this, LUMN stock price reacted positively and shot up 13.41% after earnings. However, the up move was temporary and buyers failed to give the follow-up momentum.
Therefore, it can also be considered as a bullish trap. Lumen stock faced rejection from $2.00 and reverted in the downward direction.
Which Will Come First in LUMN Stock $1.00 or $2.00?
LUMN stock price has corrected a lot and is down by 70.58% on a YTD basis. But still, no signs of recovery are visible. It indicates that buyers are losing confidence and are reluctant to invest.
Lumen stock price looks highly oversold and sellers are highly active due to which the risk of short squeeze is high.
Till the LUMN stock price holds the $1.40 the possibility of testing $2.00 remains high. However, until buyers succeeded in breaking the $2.00 hurdle and sustain. The reliability of the upmove will remain doubtful.
Lumen Stock Bearish on Multiple Time Frames
Lumen stock price is bearish on daily, weekly, and monthly timeframes. However, the prices are oversold so it is better to avoid creating any position.
LUMN stock is quite volatile and speculative activities are also high. Therefore, the buyer needs to be very careful before creating any positions.
The MACD curve sloping sideways indicates prices might consolidate for some time before deciding further direction. The RSI at 42 denotes weakness but if prices recovers it might reach the neutral territory.
Conclusion
Lumen Technologies Inc.’s LUMN stock price fell 11% in August and formed a bearish pattern. However, Lumen stock price looks oversold so a wild short squeeze might trigger any time to clear the previous shorts.
Technical levels
- Resistance levels: $2.09 and $2.37
- Support levels: $1.40 and $1.20
Disclaimer
The views and opinions stated by the author, or any people named in this article, are for informational purposes only. They do not establish financial, investment, or other advice. Investing in or trading crypto assets comes with a risk of financial loss.
Mr. Pratik chadhokar is an Indian Forex, Cryptocurrencies and Financial Market Advisor and analyst with a background in IT and Financial market Strategist. He specialises in market strategies and technical analysis and has spent over a year as a financial markets contributor and observer. He possesses strong technical analytical skills and is well known for his entertaining and informative analysis of the Financial markets.


