
 Home
Home News
News
- 1 Exxon Mobil stock price closed at $113.52 while witnessing a gain of 2.1% during the last intraday trading session.
- 2 XOM stock price has climbed above 20, 50, 100, and 200-day exponential moving averages.
- 3 The year-to-date return of Exxon Mobil is 3.41%.
Exxon Mobil (XOM) stock price has been in a strong bullish trend since mid-July 2023, rising from the low of $100.50. The stock price has surged roughly 13% from the low. The energy sector has been witnessing notable strength which has turned energy stocks like Exxon Mobil and Chevron bullish.
However, during mid-August, the bullish momentum was halted as the price reached near $112. The stock price retraced and consolidated between the range of $112 and $106 for several days.

Since the last six trading days, the stock price printed a bullish candle and the last candle was successful in breaking and closing above $112.

If the next candle can break the high of the previous candle and the bullish momentum prevails, the price can head toward the next resistance level of $118.50 and potentially break the yearly high of $119.92.
On the other hand, if the price melts back into the previous zone, it might head down toward the previous support level of $106. However, the probability of a bearish move happening is less due to the strong participation of bulls in the market.
Quarterly Report Of Exxon Mobil Corporation
Oil prices have been on the rise, hitting the highest monthly close since October 2022. For the second quarter, Exxon Mobil’s total revenue and other income were $82.91 Billion, down 28.3% year-over-year.
The net income has also declined 55.6% year-over-year to $7.88 Billion. The earnings per share has also declined by 53.9% to $1.94 from the previous year’s values.
For the third quarter ending, the revenue and earnings per share are expected to decline by 23.1% and 51.4% year over year to $86.15 billion and $2.16, respectively.
Will XOM Stock Price Continue Surging?
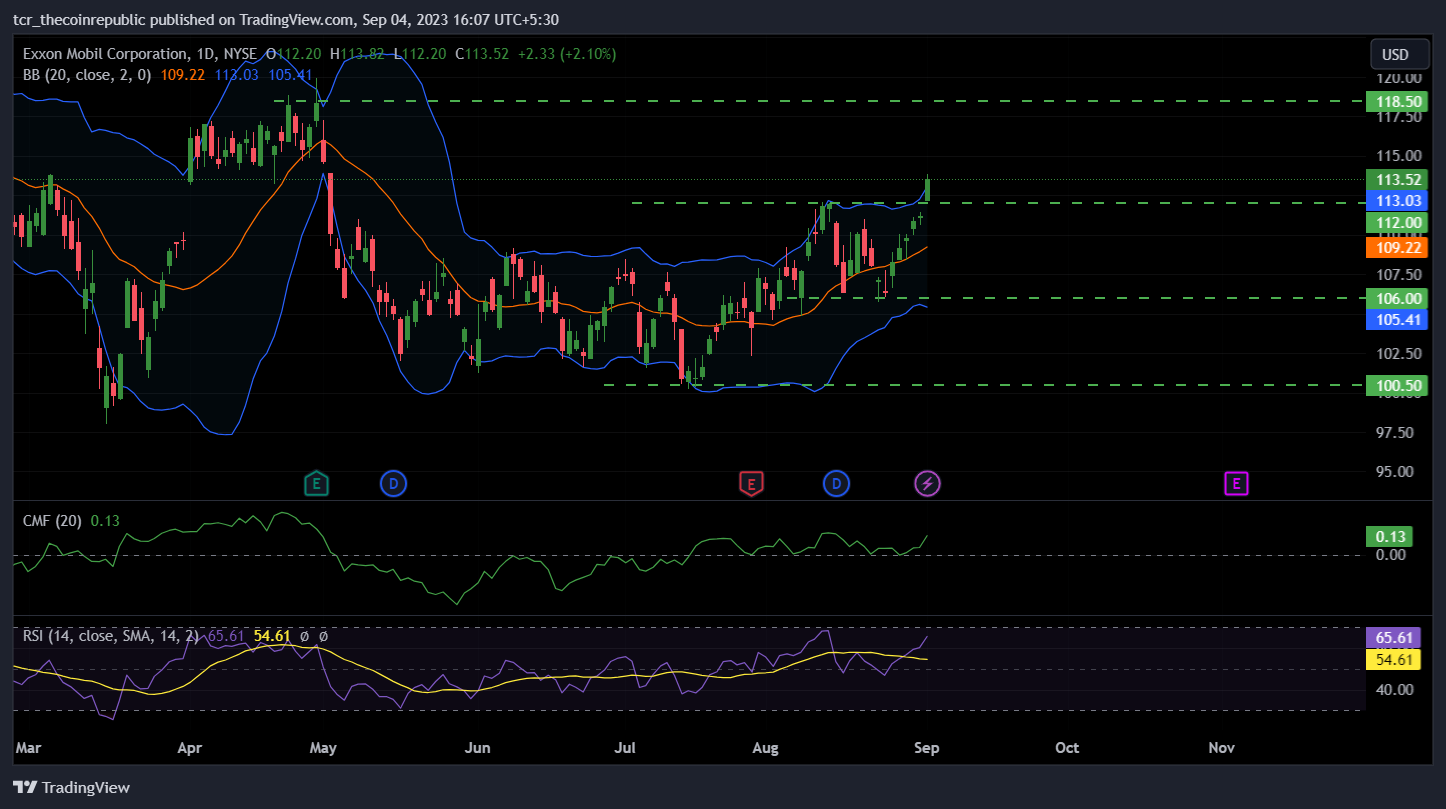
The stock price has surged above 20,50,100 and 200-day exponential moving averages, suggesting bullish momentum. The Chaikin money flow score has been trading above the 0 mark since 17 July 2023, indicating a confluence of bulls over the price. CMF stands at 0.13, indicating strength in the market.
The relative strength index is currently on a strong upward trajectory and has crossed the 60 mark. RSI currently stands at 65.61, nearing the overbought zone, suggesting bullish momentum in the stock price.
The Bollinger bands have started to expand, indicating a rise in volatility. XOM stock price has reached above the upper band of Bollinger which indicates the possibility of short-term pullback.
Conclusion
The market structure and price action of Exxon Mobil is highly bullish and has performed a breakout above the resistance level of $112.
Technical Levels
- Major support: $100.50 and $106
- Major resistance: $118.50 and $122
Disclaimer
The views and opinions stated by the author, or any people named in this article, are for informational purposes only. They do not establish financial, investment, or other advice. Investing in or trading crypto assets comes with a risk of financial loss.
Mr. Pratik chadhokar is an Indian Forex, Cryptocurrencies and Financial Market Advisor and analyst with a background in IT and Financial market Strategist. He specialises in market strategies and technical analysis and has spent over a year as a financial markets contributor and observer. He possesses strong technical analytical skills and is well known for his entertaining and informative analysis of the Financial markets.


