
 Home
Home News
News
- 1 Uniswap price (UNI) is up by 0.89% in the last 24 hours and is currently trading at $4.45.
- 2 Uniswap Crypto price fell nearly 23% in August Month.
- 3 Uniswap (UNI) dropped below key moving averages and struggled to sustain above $4.
Uniswap price has been in a strong declining trend after a short-term gain in January 2023. The price tried to sustain at the upper levels but the domination of sellers at the upper levels led to the formation of double top and the price declined.

Thereafter, the price has been declining steadily forming lower highs and lower lows to form a new swing low in June 2023. However, the buyers made an attempt to recover after the formation of the swing but failed to break above the previous swing high and the price declined sharply in the past 1 month.
Uniswap price currently trades at $4.45 with an intraday gain of 0.89%. The crypto holds a market cap of 2.58 Billion and ranks at 26th in the overall crypto ranking. UNI is a decentralized protocol that allows automated and open trading of DeFi tokens.
Uniswap Price Prediction Using Price Action Strategy

Recently, the Uniswap price made a breakout of the 50 and 200 EMA indicating strength in the trend, however, it did not last long, and the price declined sharply. Currently, the price is nearing its previous demand zone. The price is following a channel pattern and declining towards the lower trendline of the channel pattern. The price may slid more as the bears are dominating at the current moment.
Also, the volume analysis shows that the volume received is less than the average volume indicating the bearishness in the market. The UNI token has received a $67.4 Million volume in the past 24 hours which is nearly 12% more than the past day.
UNI Price Forecast from Indicators’ point of view
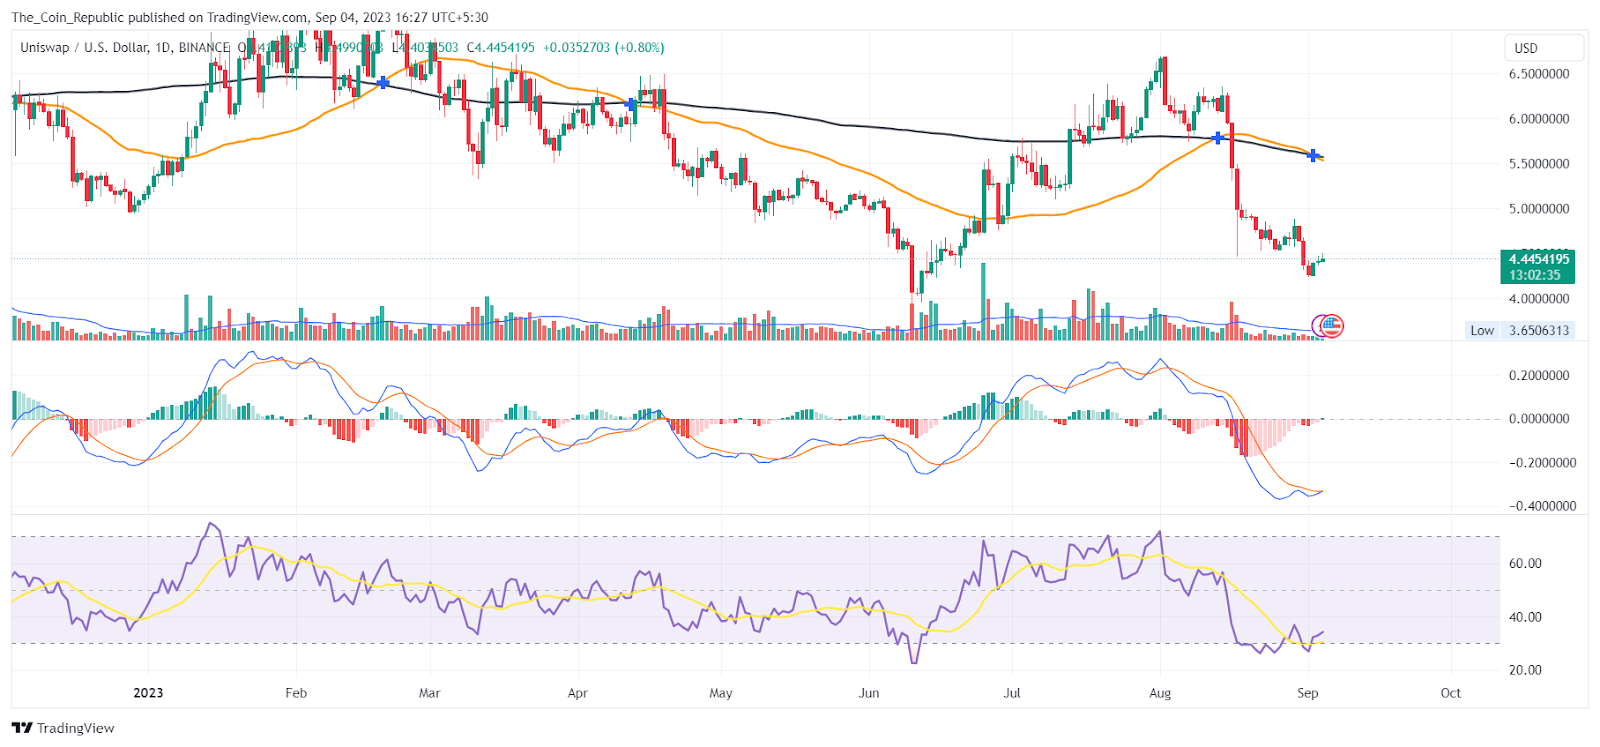
MACD lines have made a bullish crossover indicating the buyers are trying to defend the support levels. However, histogram bars are being formed of negligible size indicating weak buyers participating in the market.
The EMA analysis suggests that the UNI price failed to sustain above the 50 EMA indicating bearishness in the short term. The price is already below the 200 EMA indicating a long-term weakness on the daily chart.
At the time of publishing, the RSI value of the UNI token is 34.04 and that of the SMA line is 29.3. RSI is trying to recover after entering an oversold region.
Conclusion
Uniswap is a decentralized protocol for trading DeFi tokens. The price has been in a downtrend for the last 6 months, forming lower highs and lower lows. The price broke below the 50 and 200 EMA, showing weakness in the trend. The price is now approaching its previous demand zone and the lower trendline of a channel pattern. The volume is low, indicating bearishness in the market. The price currently trades at $4.45 with a slight intraday gain.
Technical Levels
- Support levels: $4.47 and $3.52.
- Resistance levels: $6.68 and $7.34.
Disclaimer
The views and opinions stated by the author, or any people named in this article, are for informational purposes only and do not establish financial, investment, or other advice. Investing in or trading crypto or stock comes with a risk of financial loss.

Adarsh Singh is a true connoisseur of Defi and Blockchain technologies, who left his job at a “Big 4” multinational finance firm to pursue crypto and NFT trading full-time. He has a strong background in finance, with MBA from a prestigious B-school. He delves deep into these innovative fields, unraveling their intricacies. Uncovering hidden gems, be it coins, tokens or NFTs, is his expertise. NFTs drive deep interest for him, and his creative analysis of NFTs opens up engaging narratives. He strives to bring decentralized digital assets accessible to the masses.


