
 Home
Home News
News
- 1 Algorand crypto price decreased by 11.75% this month.
- 2 Algorand crypto price is currently trading at $0.0940 with a drop of -0.21% in the last 24 hours with a current market cap of $735.082 Million.
- 3 AlgorandUSD is under extreme bearish pressure.
The Algorand Crypto price prediction suggests the token produced an interesting declining pattern. Crypto trading below 20, 50, 100, and 200-day daily moving averages.
The ALGO price prediction shows the token faces bearish dominance on the daily time frame chart. Algorand crypto needs an increase in positive momentum in order to break out from the descending pattern. However, sellers may approach 50-SMA, acting as a resistance to the crypto price. However, the 24-hour trading volume (3.931) is lower than the 10-day average volume (8.994).
Algorand price prediction implies that investor sentiments regarding the ALGO token are bearish. Investors may prefer to keep a keen watch over the crypto. Presently, the Algorand price is below all the key EMA and MA levels. The present value of Algorand is $0.0940. It has a market capitalization of around $3.932 Million with a fully diluted market cap of $939 Million. The crypto has a circulating supply of 7.828 Billion.
Algorand has performed poorly so far this year. Year-over-year returns are -45.57%, while returns over the past 6 months are -53.45%. The return was -11.75% last month and -3.49% last week. Technicals signal selling pressure, while the technical oscillators also indicate bearishness. The moving averages are also on the strong sell side. This shows bearish dominance in the market.
Technical Analysis: Will Algorand Crypto Give Breakout?
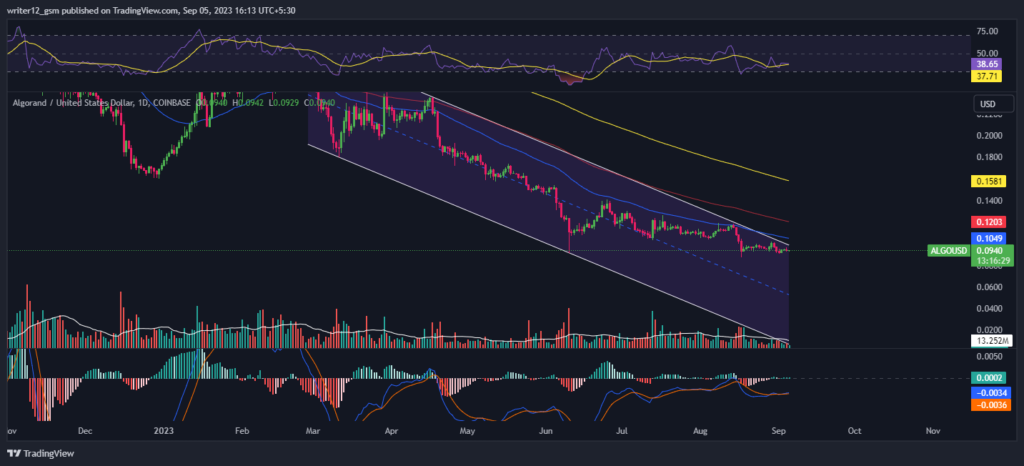
At the time of publishing, Algorand crypto (USD: ALGO) is trading below the 50 and 200-day exponential moving averages, which shows bearish momentum. However, if more selling volume adds up, then the price might conquer supporting EMAs by making lower highs and lows. Hence, the Algorand price is expected to move downwards, giving bearish views over the daily time frame chart.
The current value of RSI is 38.65 points. The 14 SMA is below the median line at 37.71 points which indicates that the ALGO crypto is bearish. The MACD line at -0.0034 and the signal line at -0.0036 are below the zero line. A bearish crossover is observed in the MACD, which signals more bearishness for the Algorand crypto price.
Summary
Algorand (USD: ALGO) technical oscillators are trading in the negative territory. The MACD, RSI, and EMA are giving a negative outlook and imply that the downtrend may continue in the ALGO crypto price. ALGO price action indicates that the traders and investors are bearish on the daily and weekly time frame. The price action reflects a bearish outlook at the moment.
Technical Levels
- Support Levels: $0.0808 and $0.0682.
- Resistance Levels: $0.1124 and $0.1314.
Disclaimer
The analysis provided in this article is for informational and educational purposes only. Do not rely on this information as financial, investment, or trading advice. Investing and trading in crypto involves risk. Please assess your situation and risk tolerance before making any investment decisions.

Nancy J. Allen is a crypto enthusiast, with a major in macroeconomics and minor in business statistics. She believes that cryptocurrencies inspire people to be their own banks, and step aside from traditional monetary exchange systems. She is also intrigued by blockchain technology and its functioning. She frequently researches, and posts content on the top altcoins, their theoretical working principles and technical price predictions.


