


The price prediction of the Chainlink over the weekly chart (LINK) shows that the coin price has been maintaining a range with a lower level of $5 and an upper level of $9 for the last 400 days. The price is being traded continuously in a range of 40%.
The daily chart shows that the crypto price surged higher after hitting a low of $4.77 in June and made a high of $8.8, almost touching the upper range and declining.
The price then declined suffering rejection from an upper trendline resistance. The bulls made an attempt to halt the price above the 200 EAM. but the bears dominated from the upper supply zone dragging the price to break below the key moving average of 50 and 200 EMA.
Currently, the price is trying to sustain the previous demand zone of $6 and consolidating to accumulate buyers and shift the short-term trend.
Chainlink Token (LINK) is a network that enables smart contracts to use data from outside sources. It has many reliable partners that provide data for various purposes. Chainlink allows data providers to sell their data directly to the network and earn money from it.
Chainlink Price Declined Suffering Rejection From An Upper Trendline
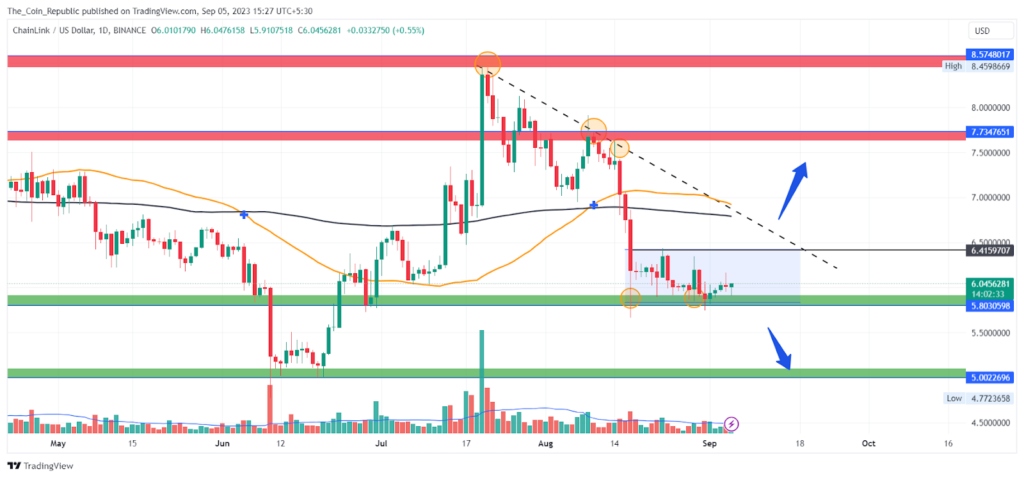
The Chainlink price is currently trading at $6.09 and consolidating near the previous demand zone for the last 18 days. The Crypto might be accumulating buyers to counter the selling pressure. For Now, the price trend is indecisive until the price remains in the zone.
The breakdown of the range may wipe out another 10% of the market capitalization and drag the price down to $5.
However, if more buyers accumulate at the lower levels and the price manages to break above $6.4 then it may gain 15-20% to reach the upper supply levels.
Technical Indicators Showing Indecisive Trend At The Moment

MACD lines have made a bullish crossover. Also, histogram bars are being formed above the mean line with increasing height showing that the bearish sentiment might come to an end and the coin may show bullishness.
The EMA analysis shows that the LINK price dropped below the 50 and 200 EMA Indicating weakness on the charts.
At the time of publishing, the RSI value of the LINK token is 42.1 and that of the SMA line is 35.5. RSI is recovering after a decline signaling that the price may show some bullishness in the upcoming sessions.
Conclusion
The Chainlink price has been ranging between $5 and $9 for over a year. It recently rose to $8.8 but fell below the key moving averages of 50 and 200 EMA. It is now consolidating near the previous demand zone of $6, waiting for buyers to change the trend. The price is uncertain until it breaks out of the zone. A breakdown may lead to a 10% loss, while a breakout may result in a 15-20% gain.
Technical Levels
- Support levels: $5.803 and $5.02.
- Resistance levels: $7.73 and $8.57.


