
 Home
Home News
News
- 1 F stock price shows a reversal from the demand zone in the past trading session.
- 2 Buyers showed accumulation and tried to surpass the 20-day EMA.
Ford Motors (F stock) price shows a reversal from the demand zone and is trying to surpass the 20-day EMA in the past sessions. Moreover, the price action shows that F stock hovers in a narrow range and stays below the cluster of $13. Furthermore, the chart structure indicates bear dominance, and buyers have failed to surpass the hurdle of $14 and have faced rejection for the past sessions.
However, F stock persisted in rebounding from the demand zone and showed a vital support region near $12, which sellers failed to break, and buyers succeeded in bouncing. These bounces and falls have persisted in the past weeks, and prices remained narrow, showing roller coaster moves. The lower trajectory of $11.50 is the strong demand zone, which is a boon for the bulls to prevent the free fall attempted by the sellers for the past weeks.
At press time, F stock price is trading at $12.14 with an intraday gain of 0.08%, showing neutrality on the charts. Moreover, the trading volume remained at 34.767 Million, and the market cap is $48.587 Billion. However, Analysts maintained a buy rating with a yearly target price of $14.77, suggesting a growth outlook for the following sessions.
Ford Motor Co. engages in the manufacture, distribution, and sale of automobiles. It operates through the following segments: Ford Blue, Ford Model E, Ford Pro, Ford Next, and Ford Credit. The Ford Blue, Ford Model E, and Ford Pro segment includes the sale of Ford and Lincoln vehicles, service parts, and accessories, together with the associated costs to develop, manufacture, distribute, and service the vehicles, parts, and accessories.
The Ford Next segment focuses on development costs for autonomous vehicles and related businesses, equity ownership in Argo AI, and other mobility businesses and investments.
F Stock Shows Reversal On Daily Charts
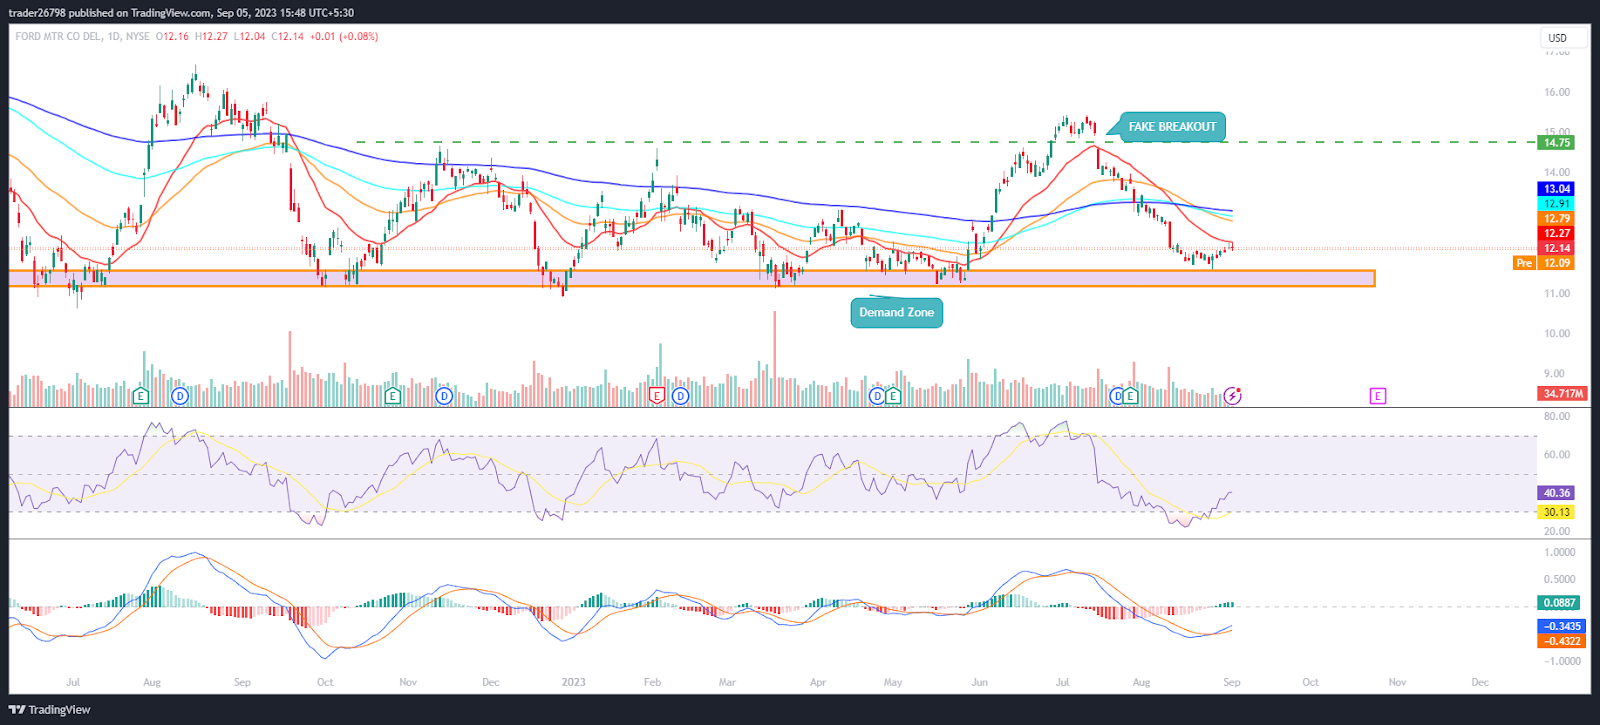
On the daily charts, the F stock price shows a reversal from the demand zone and stayed below the neutral zone, trying to surpass the 20-day EMA. Moreover, the price action shows sellers’ control over the past sessions and does not permit bulls to escape the cluster of $14 and remain in a narrow congestion zone.
The RSI curve stayed in the oversold region and showed a bearish divergence, indicating a negative crossover on the charts. Moreover, the chart suggests a volatile structure, suggesting a negative outlook.
The MACD indicator shows a bullish crossover and formed green bars on the histogram, showing a reversal in the last trading sessions.
Summary
Ford Motors (F stock) price shows a reversal, and attempting to surpass the 20-day EMA shows buyers accumulation on the charts. Moreover, the price action shows that the bounce will continue and follow the buying action displayed on the charts, which may lead to retesting the cluster of $13 soon. The primary hurdle of $13 needs to be surpassed to extend the bullish momentum toward $14.
Technical Levels
Support Levels: $12 and $11.50
Resistance Levels: $13 and $15
Disclaimer
The views and opinions stated by the author or any people named in this article are for informational purposes only, and they do not establish financial, investment, or other advice. Investing in or trading crypto or stock comes with a risk of financial loss.

Adarsh Singh is a true connoisseur of Defi and Blockchain technologies, who left his job at a “Big 4” multinational finance firm to pursue crypto and NFT trading full-time. He has a strong background in finance, with MBA from a prestigious B-school. He delves deep into these innovative fields, unraveling their intricacies. Uncovering hidden gems, be it coins, tokens or NFTs, is his expertise. NFTs drive deep interest for him, and his creative analysis of NFTs opens up engaging narratives. He strives to bring decentralized digital assets accessible to the masses.


