
 Home
Home News
News
- 1 LULU stock price is currently trading at $404.19 with a spike of 6.01% in the last 24 hours and a current market cap of $53.215 Billion.
- 2 Bulls continue to show dominance.
- 3 LULU stock gave attractive Q2 results with a remarkable 18% revenue growth.
LULU stock chart structure shows a roller coaster move in the previous months. The stock was rejected multiple times from the supply range of $400. Moreover, the lower levels near $360 acted as a support region, and the stock rebounded from there, trading in a biased range. Likewise, the stock is bullish beyond the $400.
Lululemon Athletica (NASDAQ: LULU) showed exponential growth in Q2 ‘23. The company gave a revenue of $2.21 Billion with 18.24% growth and Net income of $341.6 Million with a 17.99% growth rate. The net profit margin is 15.46% with a 0.26% decline and the operating income was $479.26 million with 22.56% growth. Additionally, the company reported a Net change in cash of $156.92 Million with 204% growth.

Lululemon Athletica stock was traded at $404 at press time with an intraday spike of 6.01%, showing neutrality in the last trading session. Moreover, the intraday trading volume was 5.176 Million. The market cap of Lululemon Athletica stock is $53.215 Billion. The stock shows the bulls’ strength, maintaining gains.
On the daily charts, LULU stock stayed on the top near the supply zone, holding the gains convincingly. Buyers have an edge and have dominated the past few trading sessions. Moreover, the price persisted in forming higher highs, and sellers were trapped during the rebound.
As per the stock technicals, analysts maintained a buy rating, and the target price of $450 was recently retested, showing the stock’s bullishness.
Technical Analysis of LULU Stock Price in 1-D Timeframe
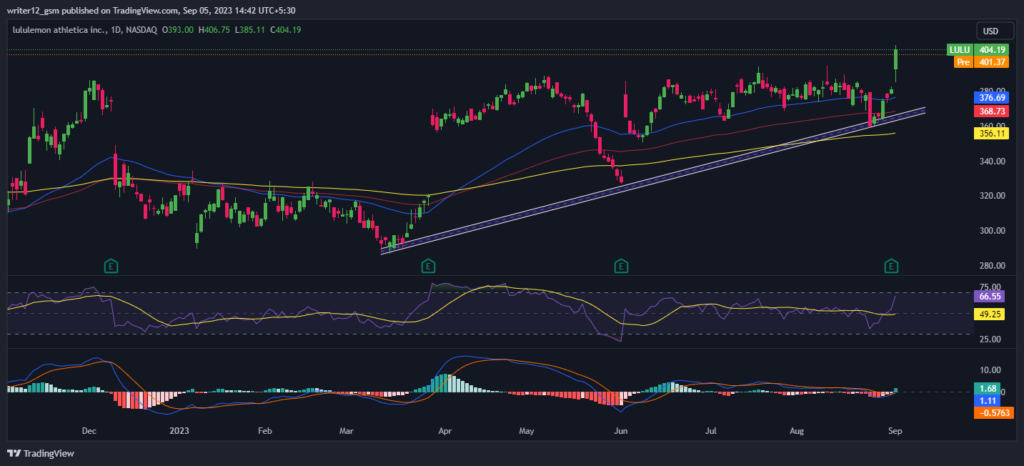
Currently, LULU stock (NYSE: lululemon athletica) is trading above the 50 and 200-day SMAs (simple moving averages), which are supporting the price momentum. Nevertheless, if buying volume adds up, then the price might support bullish momentum by making higher highs and new highs. Hence, the LULU price could move upwards giving bullish views over the daily time frame chart.
The current value of RSI is 66.55 points. The 14 SMA is above the median line at 49.25 points which indicates that the LULU stock is bullish. The MACD line at 1.11 and the signal line at -0.5763 are above the zero line. A bullish crossover is observed in the MACD indicator which signals strength in the momentum of the Lululemon Athletica stock price.
Summary
LULU established a strong bullish momentum in the last few trading sessions. Moreover, the price is trading beyond the significant moving averages and shows the buyers’ strength. Nevertheless, sellers remained cautious and waited for a fall to show their presence. But looking at the surge, they were covering their positions and remained on the back foot. Furthermore, buyers persisted in making long positions and are gradually heading toward the next upward level.
Technical Levels
- Support Levels: $397.33 and $378.57.
- Resistance Levels: $413.40 and $448.23.
Disclaimer
The analysis provided in this article is for informational and educational purposes only. Do not rely on this information as financial, investment, or trading advice. Investing and trading in stock involves risk. Please assess your situation and risk tolerance before making any investment decisions.

With a background in journalism, Ritika Sharma has worked with many reputed media firms focusing on general news such as politics and crime. She joined The Coin Republic as a reporter for crypto, and found a great passion for cryptocurrency, Web3, NFTs and other digital assets. She spends a lot of time researching and delving deeper into these concepts around the clock, and is a strong advocate for women in STEM.


