
 Home
Home News
News
- 1 Lunc crypto price is currently trading at $0.00006045 with a drop of 1.13% in the last 24 hours with a current market cap of $350.749 Million.
- 2 Terra Classic crypto price decreased by 3.71% over the past seven days.
The LUNC crypto continues to exhibit weakness on the charts, with sellers exerting significant pressure in recent trading sessions. Furthermore, the chart structure favors the bears, and the price continues to form negative candles, which shows the bear’s dominance on the chart.
Similarly, the LUNC demonstrated a reduction in user activity which also resulted in an adverse sentiment for the crypto and led to bearishness in the charts. The ongoing trend favors bears, and the crypto was also in a bearish phase, which made buyers cautious. Moreover, the Terra Classic trades below the significant moving averages.
At the time of writing, the Terra Classic price is trading at $0.00006045 with an intraday drop of 1.13% Moreover, the intraday trading volume increased by 294.18% to $43.61 Million and the market cap is $350.749 Million.
Technical Analysis: Will Lunc Crypto Bounce Back?
Crypto has had a poor performance over the years. Year-to-date it gave negative returns of -58.33% and -59.48% in the span of 6 months. In the last month, it gave a negative return of -22.12% and -3.70% in the last seven days indicating a long bearish trend continuing till now.
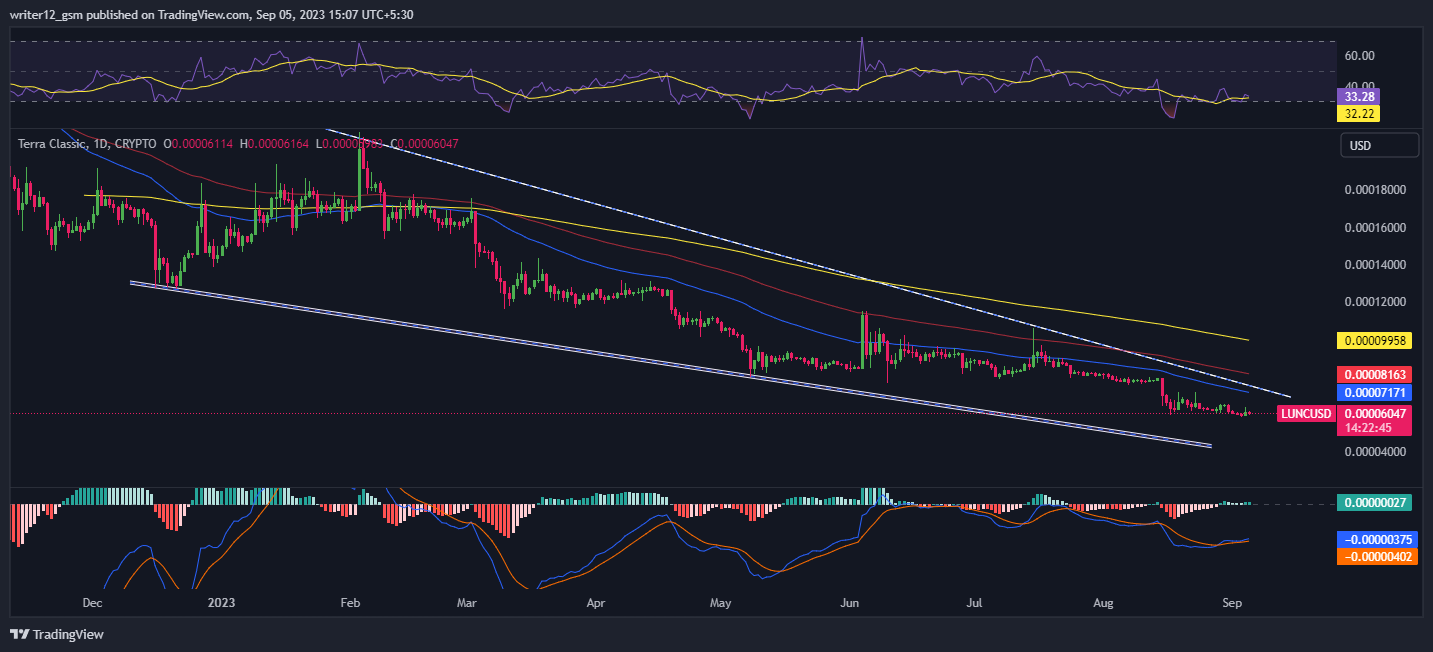
At the time of publishing, LUNC crypto is trading below the 50 and 200-day EMAs, which did not support the price trend.
The current value of RSI is 33.28 points. The 14 SMA is above the median line at 32.22 points which indicates that the Terra Classic crypto is bearish.
The MACD line at -0.000000375 and the signal line at -0.000000402 are above the zero line. A bearish crossover is observed in the MACD indicator which signals more bearishness for the LUNC crypto price.
On the 4-hour charts, the Terra Classic price is stuck in a narrow range and does not signal any rise because of low volume levels. Moreover, a key indicator is still in the neutral range and does not signal any bullishness.
The MACD indicator shows green bars on the histogram with a bullish crossover but did not signal any substantial upswing. The RSI curve is near 30, in the neutral range, and showed a narrow consolidation move on the short-term charts.
Summary
LUNC crypto is in strong bearish momentum. The LUNC crypto price chart shows an interesting declining pattern. Crypto struggles to move above 20, 50, 100, and 200-day daily moving averages. The MACD, RSI, and EMAs reflect a bearish outlook.
Technical Levels
- Support Levels: S1= $0.00005300 and S1= $0.00004500.
- Resistance Levels: R1= $0.00007600 and R2= $0.00009000.
Disclaimer
The analysis provided in this article is for informational and educational purposes only. Do not rely on this information as financial, investment, or trading advice. Investing and trading in crypto involves risk. Please assess your situation and risk tolerance before making any investment decisions.

Andrew is a blockchain developer who developed his interest in cryptocurrencies while pursuing his post-graduation major in blockchain development. He is a keen observer of details and shares his passion for writing, along with coding. His backend knowledge about blockchain helps him give a unique perspective to his writing skills, and a reliable craft at explaining the concepts such as blockchain programming, languages and token minting. He also frequently shares technical details and performance indicators of ICOs and IDOs.


