
 Home
Home News
News

- 1 Meta stock price is currently trading at $296.38 and with a market cap of $762.758 Billion (at the time of writing).
- 2 Meta Platforms, Inc. stock took a pause after a remarkable surge in price and took support on 50 EMA.
- 3 Meta Platforms, Inc.(META: NASDAQ) is ready to bounce again.
Meta stock price performed poorly this month, shedding 5.90%, but it advanced by 62.07% in the last six months. Meta Platforms Inc. (NASDAQ: META) stock gave an impressive year-to-date return of 141.31% and a positive 1-year return of 77.00%.
Meta Platforms Inc.’s (NASDAQ: META) stock price shot up 9.71% in the last three months. Currently, META’s price is trading at $296.38 and has been in a short correction phase taking support on the 50 EMA curve.

Meta stock gave a good Q2 ‘23 result as compared to the Q1 23 result. The company generated a revenue of $32.00 Billion and net income of $7.79 Billion and a profit margin of 24.34%. Meta Platforms, Inc. revenue grew by 11.02% and net income grew by 16.46% this quarter. The company has a debt of $27.288 Billion and a free cash flow of $19.04 Billion with Cash & equivalent of $14.97 Billion.
Out of 58 analysts covering Meta Platforms, Inc. stock, 46 are recommending META as a Strong Buy, 5 are recommending META as a Buy, 6 are recommending share as a Hold, and 1 are recommending the stock as a Sell. Overall, the analysts’ weightage is on the strong buy side.
Will Meta Stock Price Break Above $300 Mark?
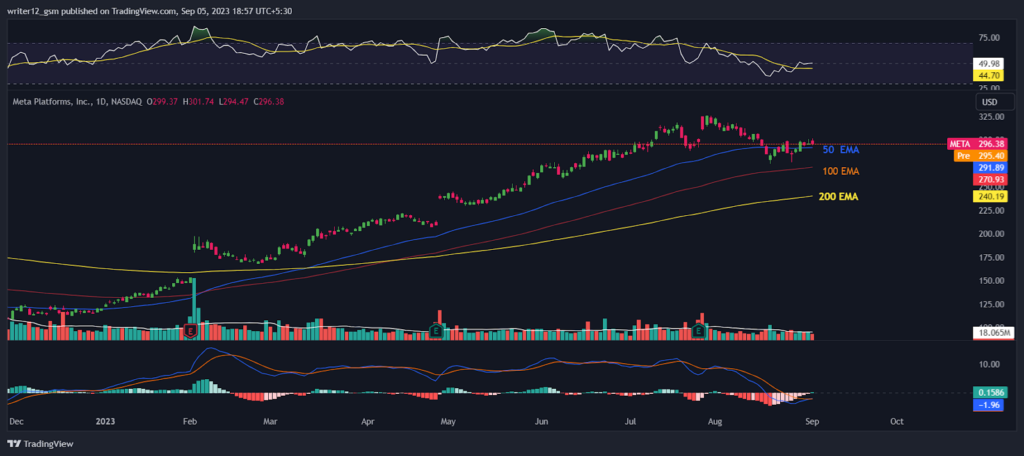
Meta Platforms, Inc. is trading above the 50, 100, and 200-day exponential moving averages, which supports the bullish trend at the current moment. The Meta price is likely to continue to rise as the daily chart shows bullish signals.
The RSI is at 50 points indicating that the price is neutral. The 14 SMA is below the middle line at 44 points, confirming the momentum is neutral as of now.
The MACD line at -1.61 and signal line at -2.02 are below the zero line and a bullish cross is expected soon in the MACD oscillator, which signals positive potential for the META stock price.
Summary
The technical indicators of the META stock price indicate a short correction in its price. The MACD, RSI, and EMA are giving positive signals and imply that the trend is neutral as of now but the uptrend may continue in META stock price. Meta Platforms Inc. has some good financial stats and moving upward. It shows that the investors and traders of the stock are bullish on the 1-D time frame. The price action emphasizes a bullish outlook at the moment.
Technical Support and Resistance Levels
Resistance levels: R1 = $326.00 and R2 = $300.00
Support levels: S1 = $270.93 and R3 = $240.19
Disclaimer
Technical analysis is based on historical patterns and trends and does not guarantee future results. The information provided in this article is for educational purposes only and does not constitute investment advice Trading involves risks and you should only invest what you can afford to lose.
Steve Anderson is an Australian crypto enthusiast. He is a specialist in management and trading for over 5 years. Steve has worked as a crypto trader, he loves learning about decentralisation, understanding the true potential of the blockchain.


