
 Home
Home News
News

- 1 ADA price chart shows a downtrend and persisted in a fall for the past sessions.
- 2 Buyers failed to rebound and hovered near the demand zone of $0.2500.
Cardano (ADA) price shows selling pressure and hovers in a narrow range below the key moving averages for the past sessions. Moreover, the ADA price action showcased seller dominance and suggested a negative outlook for the near sessions. Buyers failed to rebound and started unwinding their positions instead of fresh long positions due to the breakdown of the head and shoulders pattern in the past trading sessions.

Moreover, ADA price action shows consolidation and persisted in forming lower lows and is trading near the lower edge of the support zone. Furthermore, the chart structure shows a descending channel. The bulls are trying to surpass the upper trendline near $0.2600.

Cardano price is trading below neutrality, and the 20-day EMA shows sellers are in control and are losing the initial gains in the past sessions. The lower trajectory of $0.02400 is the primary support zone, and the channel lows of $0.2200 is the demand zone, which sellers have tried to break in the past sessions. Conversely, the upper trajectory of $0.2700 must be surpassed to gain momentum and will retest the swing of $0.3000 soon.
At press time, ADA price is trading at $0.2563 with an intraday drop of 0.58%, showing bearishness on the charts. Moreover, the trading volume increased by 1.13% to $94.52 Million, and the pair of ADA/BTC is at 0.0000995 BTC. However, the market cap of ADA is $9.01 Billion. Analysts maintained a sell rating and suggested a negative outlook for the near term.
ADA Price Action Shows Bearishness on Daily Charts
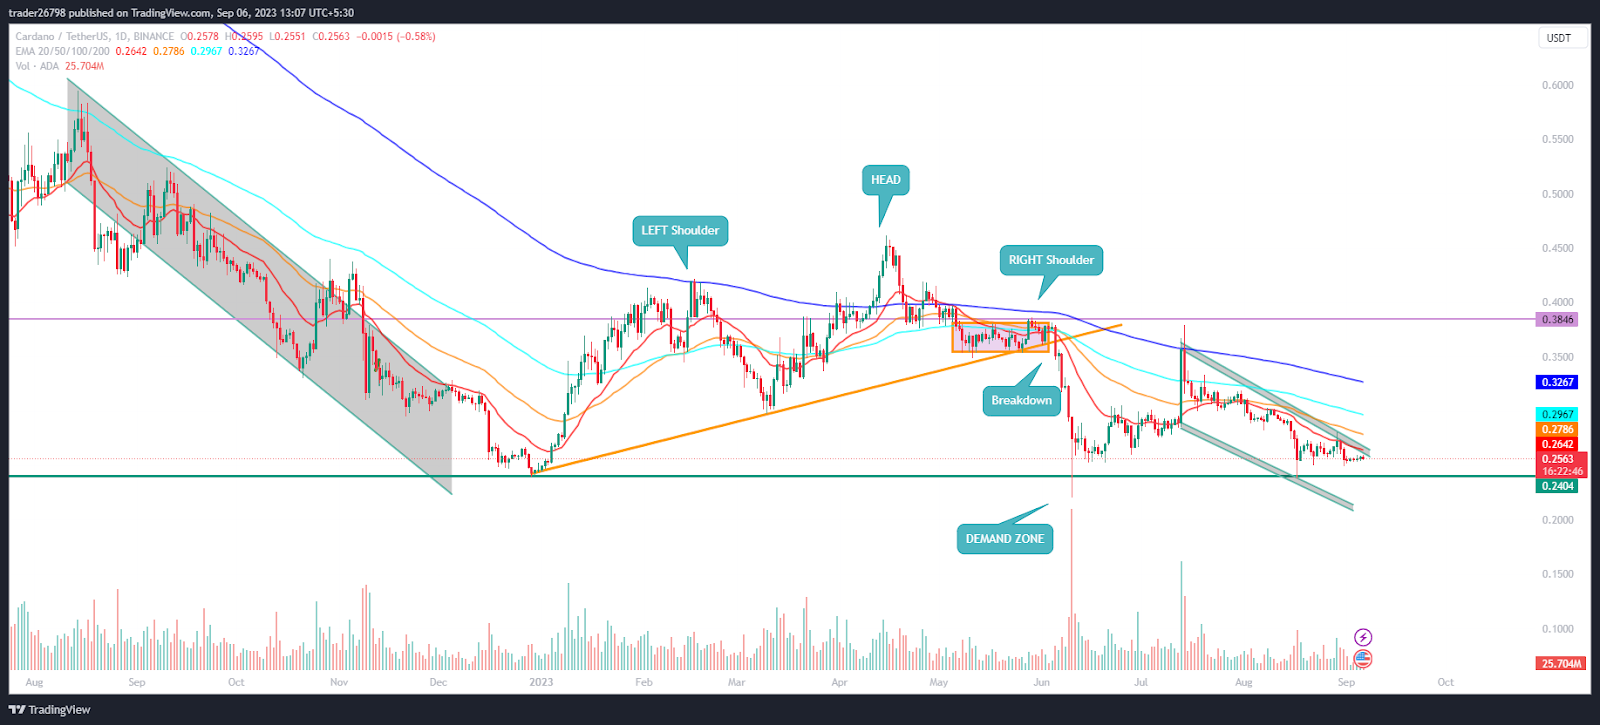
On the daily charts, ADA price shows a bearish chart structure and is trading in bear territory below the 20-day EMA. Moreover, the sellers persisted in making short buildups and putt efforts into a follow-on selloff to break the immediate support of $0.2500.
As per the Fib levels, ADA price is trading below the 50% level, near the 23.6% zone, and is on the verge of the lower Bollinger band, showing bearishness on the charts.
What Technical Indicators Say?
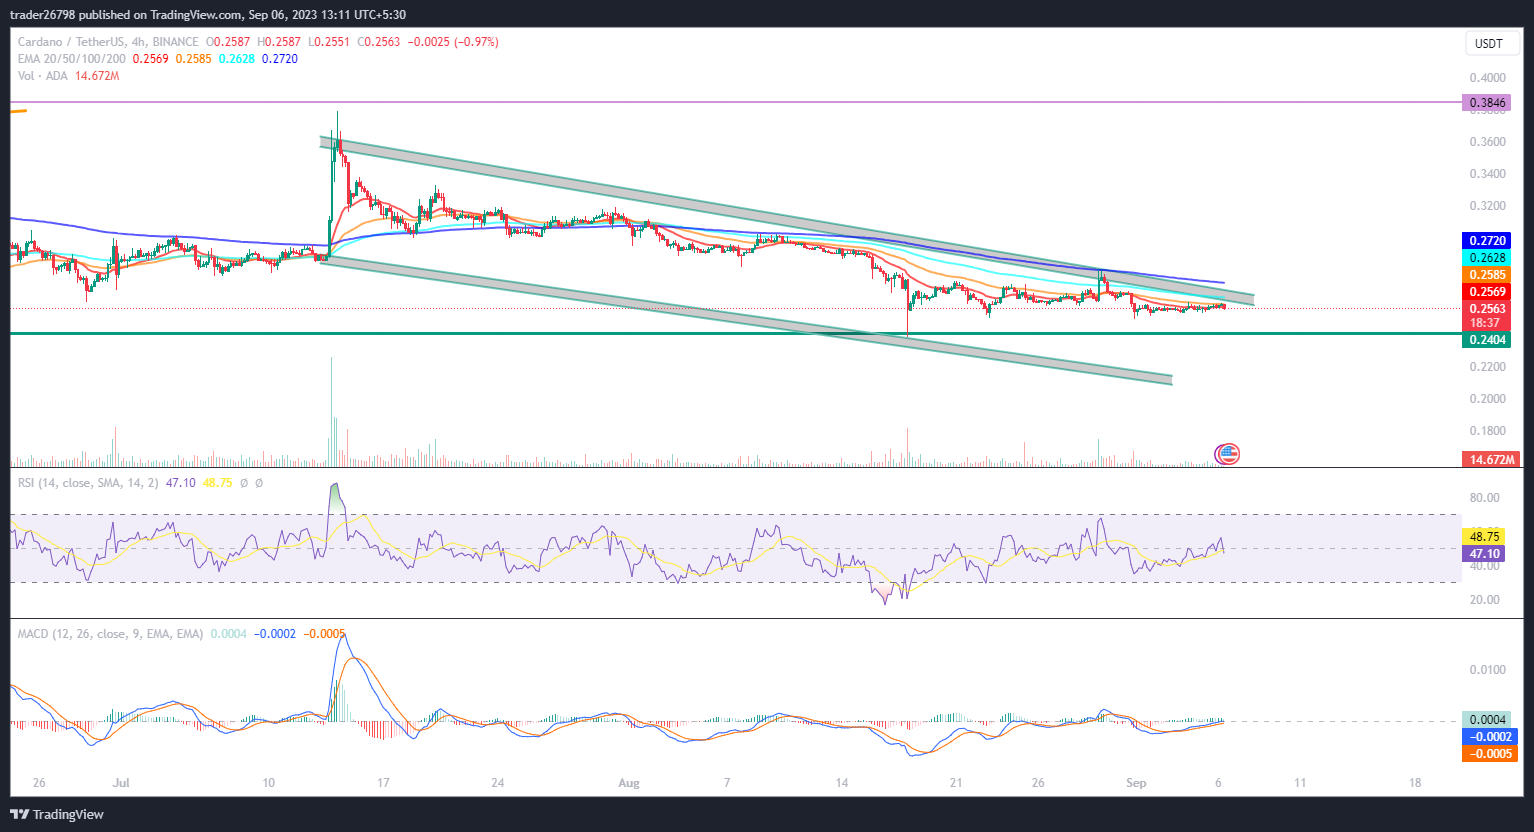
On the 4-hour charts, ADA price shows a falling channel and is now consolidating in a narrow congestion zone between $0.2400 – $0.2700 for the past sessions.
The RSI curve is above neutrality, showing bullish divergence and a positive crossover, showing that a bounce is anticipated.
The MACD indicator showed a bullish crossover and formed green bars on the histogram, showing a positive outlook for the upcoming sessions.
Summary
Cardano (ADA) price shows a bearish chart structure and a downtrend trading below the 20-day EMA in the past sessions. Moreover, the price action shows sellers are in control and indicates a consolidating move where buyers attempt to break the upper trendline but fail and hover in a biased range. Bulls need to smash the hurdle of $0.2700 to gain upward momentum.
Technical Levels
Support Levels: $0.2500 and $0.2200
Resistance Levels: $0.2700 and $0.3000
Disclaimer
The views and opinions stated by the author or any people named in this article are for informational purposes only, and they do not establish financial, investment, or other advice. Investing in or trading crypto or stock comes with a risk of financial loss.

Nancy J. Allen is a crypto enthusiast, with a major in macroeconomics and minor in business statistics. She believes that cryptocurrencies inspire people to be their own banks, and step aside from traditional monetary exchange systems. She is also intrigued by blockchain technology and its functioning. She frequently researches, and posts content on the top altcoins, their theoretical working principles and technical price predictions.


