
 Home
Home News
News

- 1 EOG stock price shows a buying momentum and looks bullish on the charts.
- 2 Buyers are attempting to surpass the cluster of $140 soon.
EOG Resources Inc. (EOG stock) price is trading above the neutrality and shows bullishness post trendline breakout near $115 in the past sessions. Moreover, the chart structure indicates a rising parallel channel, forming higher highs in the past trading sessions, where bulls are attempting to surpass the primary cluster of $140, which, if surpassed, would lead to a massive rally toward $150 followed by $160 in the upcoming sessions.
Furthermore, the technicals favor the bulls and suggest a short-term rise in the following sessions. Buyers persist in accumulating and making long build-ups and are trying to beat the overwhelmed bears to retain the swings of $150. However, the sellers have maintained their grip near the immediate hurdle of $125 and stayed cautious.

EOG share price shows the bulls’ dominance and suggests a further bull rally toward the trajectory swing of $150. Moreover, the stock trades above the significant moving averages and shows bullish momentum.
At press time, EOG stock price is trading at $133.39 with an intraday gain of 1.84%, showing bullishness on the charts. Moreover, the trading volume increased by 2.89% to 3.738 Million, and the market cap is $77.668 Billion. However, analysts maintained a buy rating with a yearly target price of $147.19, suggesting a strong growth outlook for the upcoming sessions.
EOG Resources, Inc. explores, develops, produces, and markets crude oil and natural gas. It operates through the United States, Trinidad, and Other International geographical segments. The Other International segment includes China and Canada operations. The company was founded in 1985 and is headquartered in Houston, TX.
EOG Stock Price Action Favouring Bulls On Daily Charts
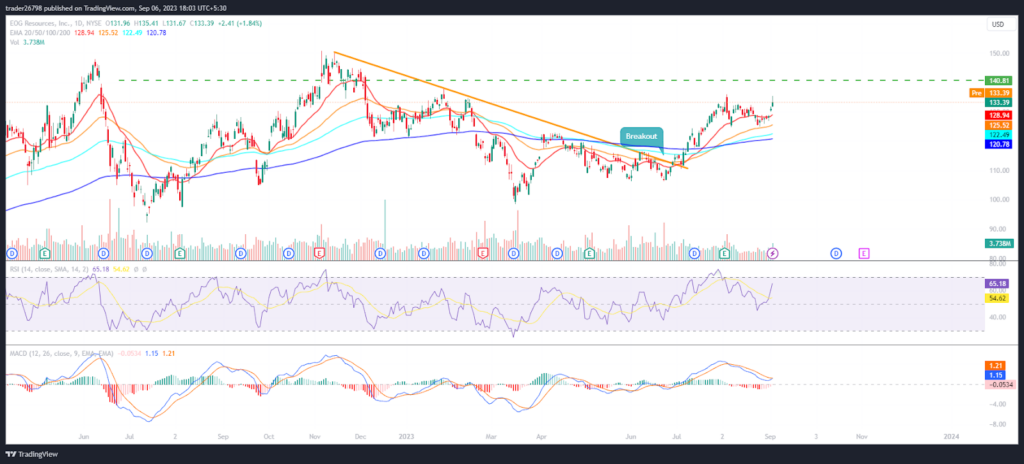
On the daily charts, EOG stock looks bullish and is favoring the bulls, suggesting an upward move toward $140 soon. Moreover, the price action showcased bulls’ accumulation and persisted in forming higher highs, which may lead the stock to revisit the supply zone of $150 in the upcoming sessions.
The RSI curve stayed in the overbought zone and showed a positive crossover, indicating an upright buying momentum on the charts.
The MACD indicator showed an end of the red bars and indicated a fresh, bullish crossover in the upcoming sessions, suggesting a positive outlook.
Summary
EOG Resources (EOG stock) is trading in the bull territory, indicating buyer accumulation on the charts. Moreover, the chart structure indicates a reversal from the support zone of $110 in the past sessions and is extending the buying momentum now to revisit the swing of $150 soon.
Technical Levels
Support Levels: $125 and $110
Resistance Levels: $140 and $150
Disclaimer
The views and opinions stated by the author or any people named in this article are for informational purposes only, and they do not establish financial, investment, or other advice. Investing in or trading crypto or stock comes with a risk of financial loss.

Adarsh Singh is a true connoisseur of Defi and Blockchain technologies, who left his job at a “Big 4” multinational finance firm to pursue crypto and NFT trading full-time. He has a strong background in finance, with MBA from a prestigious B-school. He delves deep into these innovative fields, unraveling their intricacies. Uncovering hidden gems, be it coins, tokens or NFTs, is his expertise. NFTs drive deep interest for him, and his creative analysis of NFTs opens up engaging narratives. He strives to bring decentralized digital assets accessible to the masses.


