
 Home
Home News
News

- 1 KMI stock price fell 2.58% in the intraday session on Wednesday to close at $16.63.
- 2 Kinder Morgan Inc. share (NYSE: KMI) price fell below the key moving average of 50 and 200-day EMA.
- 3 KMI stock price formed a parallel channel pattern over the daily chart.
The KMI Stock daily chart shows that the stock has been volatile with major ups and downs in the past 3 months and trading in a 10-12% range with lower support at $16 and resistance at $18. The stock has also been trading below its 200-day moving average, which acts as a dynamic resistance level.
The KMI stock price prediction states that the price is declining from the supply zone forming a parallel channel pattern. The price has shown a sharp decline after it failed to sustain above the key moving averages.

The stock recently broke below its support level of $17, which was tested several times in the past few months. The stock closed at $16.63 on Wednesday down 2.58% from the previous close.
The analysts offering a 1-year price forecast for Kinder Morgan, Inc. have a maximum estimate of $23 with a potential of 38% from the CMP. the analysts are expecting the stock to show an average growth of 22.40% to reach $20.36.
The stock has a high dividend yield of 6.79%, which may attract some value investors. Kinder Morgan Inc. (KMI) is a leading energy infrastructure company that operates one of North America’s largest networks of pipelines and terminals.

KMI stock option-chain analysis states that the current implied volatility in the market is 16.78% with an increment of 1.92% in the last trading session. The at-the-money strike price has 783 open contracts on the put side and 2252 open contracts on the call side indicating the presence of sellers at the current level. The PUT/CALL ratio is 0.54 indicating sellers dominating the overall option-chain as per the data.
KMI Stock Price Forming A Parallel Channel Pattern Over The Daily Chart
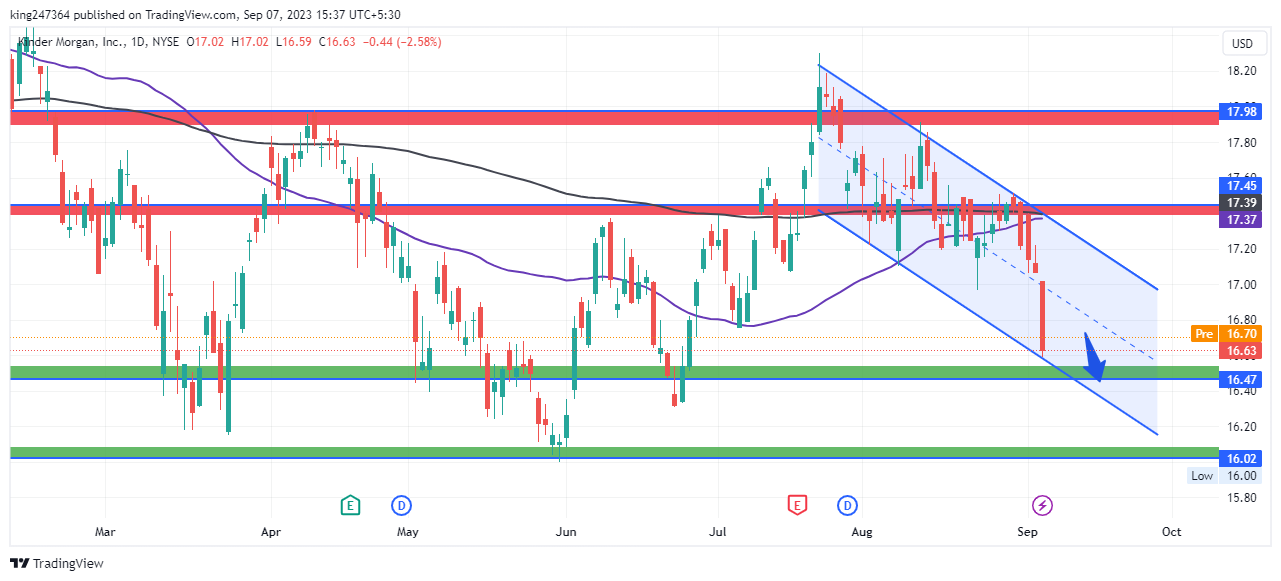
Currently, KMI stock price is trading at $16.63 and forming a parallel channel pattern over the daily timeframe.
The short-term outlook for the price trend states that the price of the stock may continue to experience downward pressure in the near term unless it can reverse its trend and break above its resistance levels.
The price may remain under the bear’s control until remains in the channel and declines to the lower support levels. The breakout of the pattern may invite buyers to enter the market and surge the price higher.
The Technical Indicators Showing Weakness Over The Charts
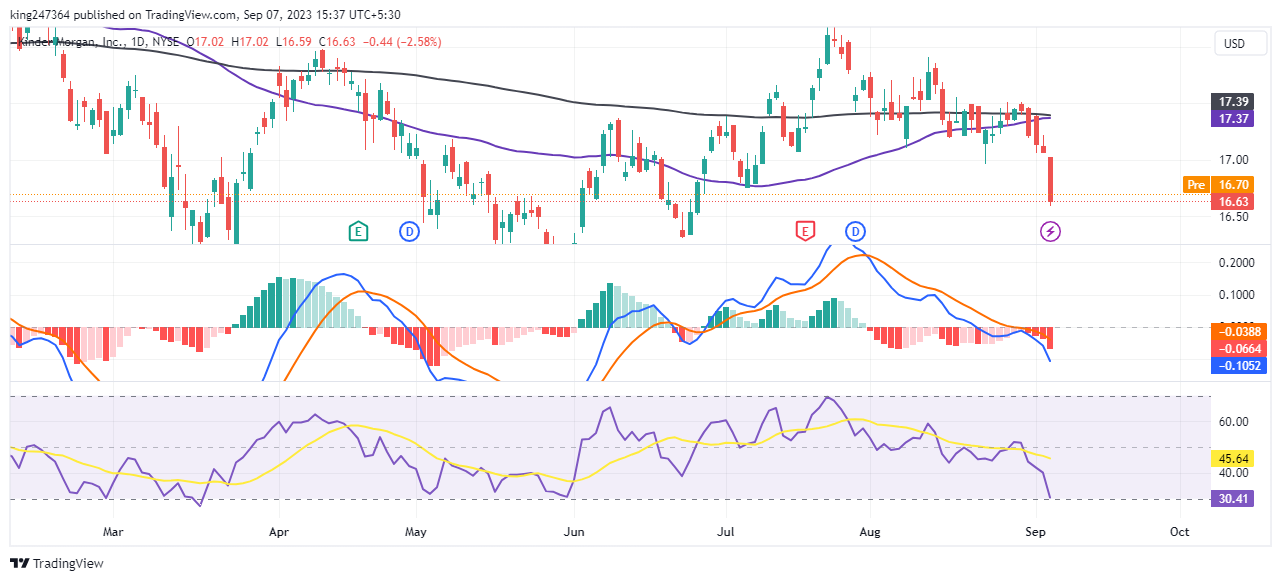
The daily KMI stock price chart shows that the price is trading below the 50 and 200-day EMA which shows bearishness on the charts. The overall technical opinion rating including RSI and MACD is 56% sell with an average short-term outlook on maintaining the current direction.
Conclusion
KMI stock price has been volatile and trading below its 200-day moving average. It broke its support level of $17 and closed at $16.63 on Wednesday. It is forming a parallel channel pattern and may decline further unless it breaks above its resistance levels. Analysts have a maximum estimate of $23 and a high dividend yield of 6.79%. The short-term outlook is bearish for KMI.
Technical Levels
- Support levels: $16.47 and $16.02.
- Resistance levels: $17.45 and $17.98.
Disclaimer
The views and opinions stated by the author, or any people named in this article, are for informational purposes only and do not establish financial, investment, or other advice. Investing in or trading crypto or stock comes with a risk of financial loss.

Andrew is a blockchain developer who developed his interest in cryptocurrencies while pursuing his post-graduation major in blockchain development. He is a keen observer of details and shares his passion for writing, along with coding. His backend knowledge about blockchain helps him give a unique perspective to his writing skills, and a reliable craft at explaining the concepts such as blockchain programming, languages and token minting. He also frequently shares technical details and performance indicators of ICOs and IDOs.


