
 Home
Home News
News

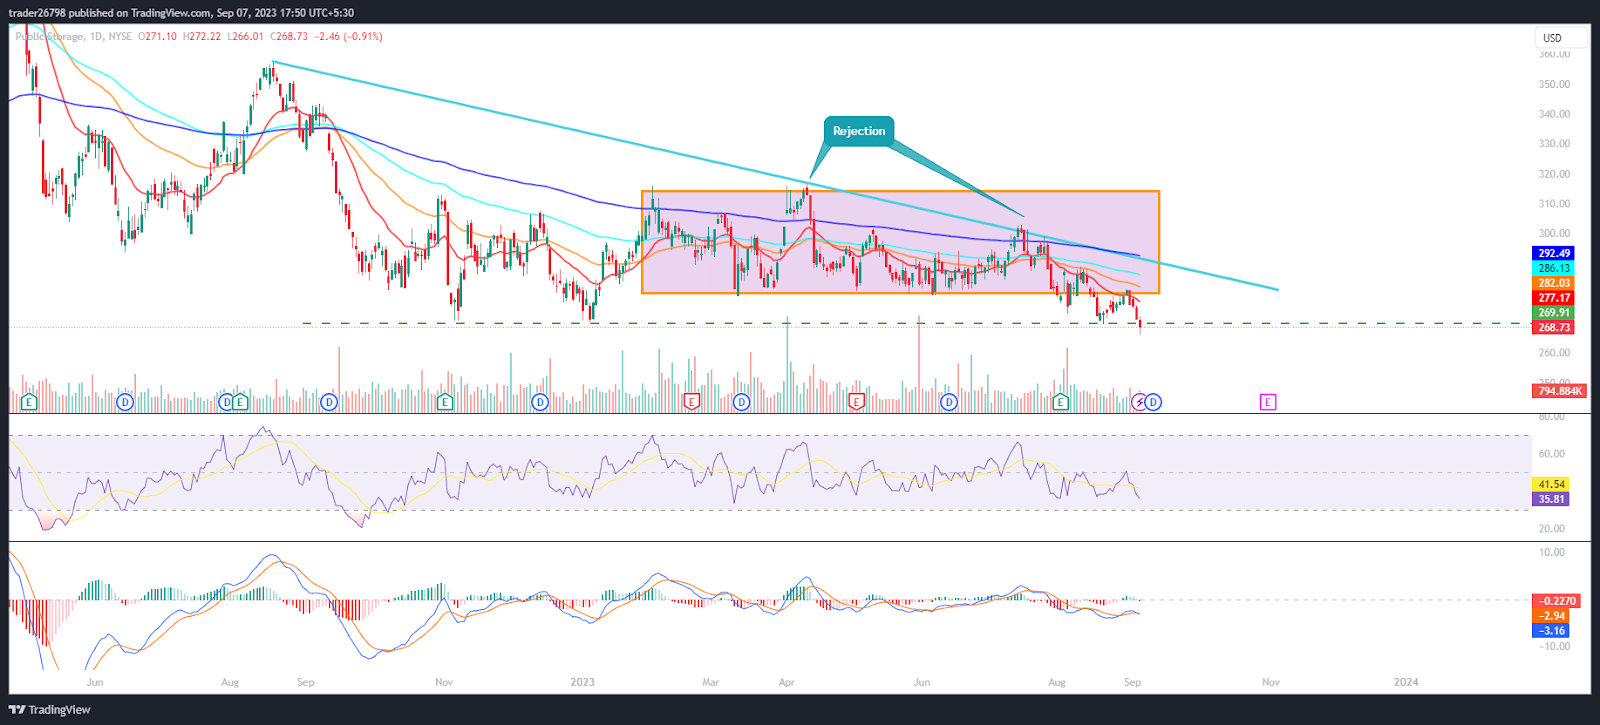
- 1 PSA stock price chart shows a range breakdown as it slips below the 20-day EMA.
- 2 Buyers faced rejection and lost the gains from the past trading sessions.
Public Storage (NYSE: PSA) stock price is in a downtrend, signaling a range breakdown on the charts. PSA stock closed below the crucial support of $270, suggesting a negative outlook for the upcoming sessions. PSA share price is trading below the significant moving averages and forming lower lows sequences over the past few trading sessions.
Furthermore, PSA stock failed to re-enter the range and is now revisiting the cluster of $270. Selling pressure in the form of massive short were seen this week, suggesting follow-on selling to the $250 level. The upper trajectory of PSA stock is near $290, from where stock faced rejection near the upper trendline and is retracing toward the lower trajectory near $260.

At press time, PSA stock is trading at $268.73 with an intraday drop of 0.91%, showing bearishness on the charts. Moreover, the trading volume increased by 1.89% to 789.676K, and the market cap is $47.683 Billion. However, analysts maintained a strong buy rating with a yearly target price of $337.11, suggesting a strong growth outlook for the upcoming sessions.
Public Storage operates as a real estate investment trust which engages in acquiring, developing, owning and operating self-storage facilities. It operates through the following segments: Self-storage Operations, Ancillary Operations, and Other Items.
The Self-storage Operations segment reflects the rental operations from all self-storage facilities. The Ancillary Operations segment deals with the sale of merchandise and reinsurance of policies against losses to goods stored by self-storage tenants, which are incidental to the primary self-storage rental activities.
PSA Stock Mirroring Bearishness On Daily Charts
On the daily charts, the PSA stock price is trading below the cluster of $280, showing bearishness for the past sessions. Moreover, PSA share was in a narrow range and has now broken the range, suggesting a negative outlook on the charts.
As per the Fib levels, PSA share is trading below neutrality and shows a negative outlook on the charts. Moreover, the price is trading below the mid-Bollinger band amid selling pressure in the past sessions.
The RSI curve remains below neutrality, showing a bearish divergence indicating a negative outlook on the charts.
The MACD indicator shows a bearish crossover forming red bars on the histogram. Follow-up selling is imminent in the upcoming sessions.
Summary
PSA stock price shows a bearish chart structure and is trading below the 20-day EMA, indicating seller dominance in the past sessions. Moreover, the price action shows the rejection from the lower neckline and continues to fall below the cluster of $270. Furthermore, the PSA stock is heading toward the lower trajectory of $250 and suggests a negative outlook for the upcoming sessions.
Technical Levels
Support Levels: $260 and $250
Resistance Levels: $280 and $300
Disclaimer
The views and opinions stated by the author or any people named in this article are for informational purposes only, and they do not establish financial, investment, or other advice. Investing in or trading crypto or stock comes with a risk of financial loss.
Steve Anderson is an Australian crypto enthusiast. He is a specialist in management and trading for over 5 years. Steve has worked as a crypto trader, he loves learning about decentralisation, understanding the true potential of the blockchain.


