
 Home
Home News
News

- 1 SNX price is gaining momentum and is close to the upper trendline near $2.40.
- 2 Buyers are showing their strength and looking for a breakout.
Synthetix (SNX) price shows buyers traction and trades inside the symmetrical triangle pattern, indicating a reversal on the charts. The bulls look aggressive and are attempting to surpass the upper trendline near $2.40, whereas sellers have decisively maintained their grip and protected the cluster. Furthermore, the chart structure shows a reversal; a breakout is imminent.

SNX price is trading above the 50-day EMA and trying to surpass the 200-day EMA, but it failed to surpass the neckline and showed a rejection wick on the charts. Furthermore, the trading volume showed an inclination indicating buyers’ interest and persisted in making long build-ups. However, the bears stayed cautious, made a strong barrier near $2.40, and did not permit bulls to surpass the cluster.

At press time, SNX price is trading at $2.281 with an intraday drop of 0.41%, showing a rejection in the yesterday’s session. Moreover, the trading volume increased by 12.90% to $97.95 Million, and the pair of SNX/BTC is at 0.0000884 BTC. However, the market cap of SNX is $738.45 Million.
SNX Price Action Suggests Breakout On Daily Charts
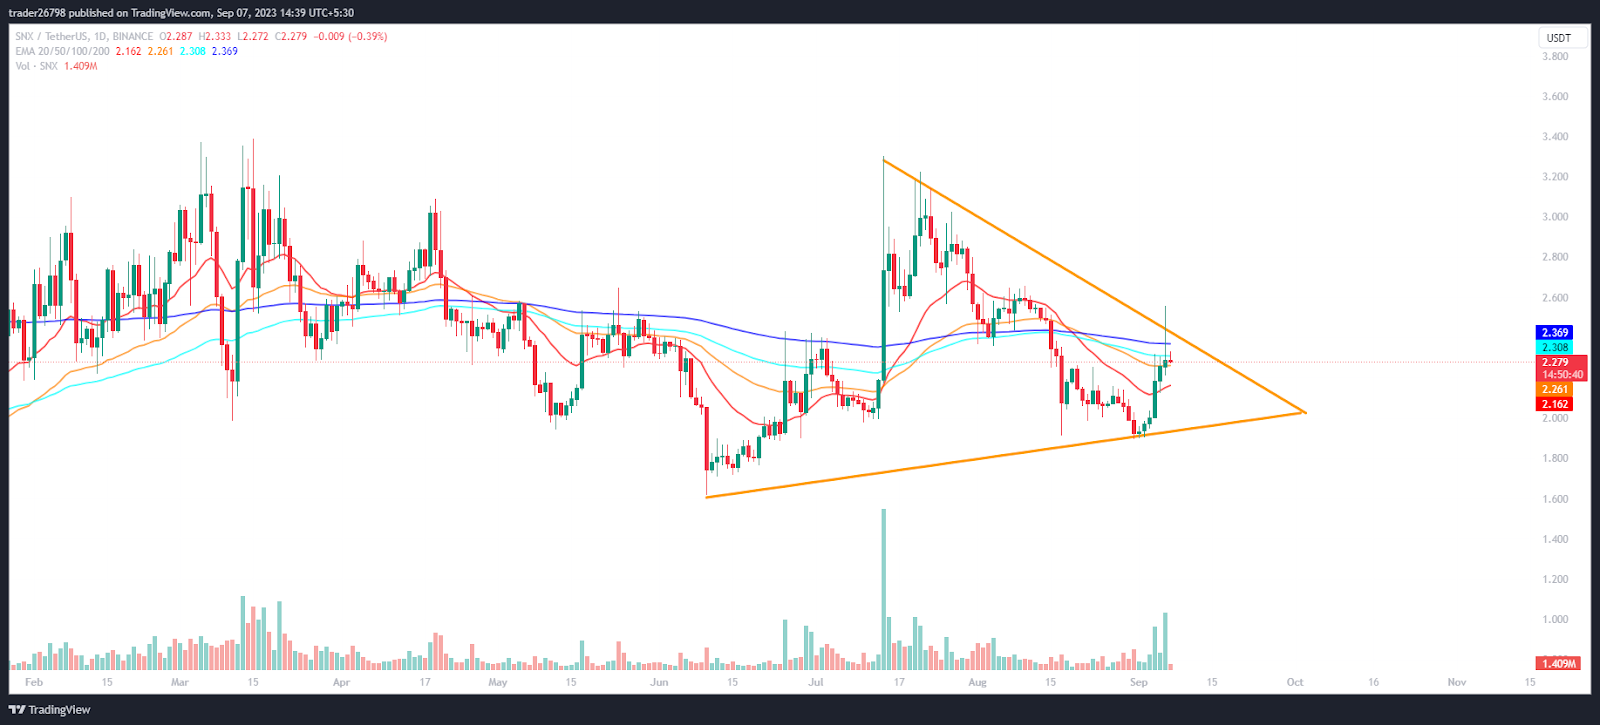
On the daily charts, SNX price action looked bullish. If $2.4 is surpassed, the $2.80 and $3.30 swings will be retested. Furthermore, the price has surpassed the 38.2% Fib level and is close to the 50% zone, showing a reversal from the support zone. Moreover, SNX price also surpassed the mid Bollinger band and is trying to extend the gains beyond the hurdle of $2.50.
What Technical Indicators Say?
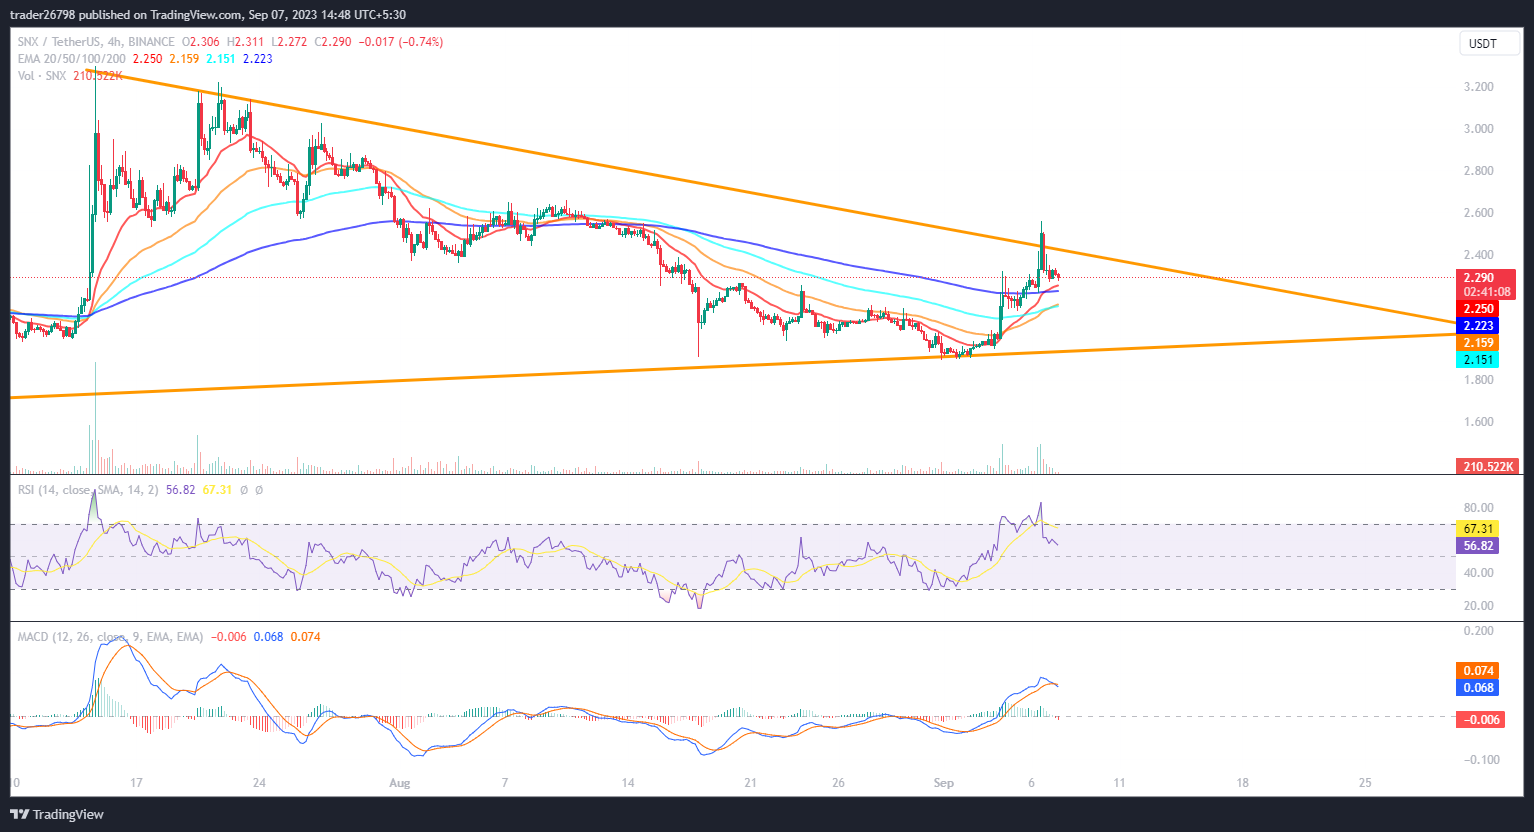
On the 4-hour charts, SNX price is showing a rejection while surpassing the upper trendline and is heading to retest the 20-day EMA support. However, the price action suggests a reversal, and a bounce needs to smash the primary hurdle of $2.50.
The RSI curve stayed in the overbought zone and showed a positive crossover, suggesting that follow-up buying could be witnessed in the upcoming sessions.
The MACD indicator shows a bullish crossover and persisted in forming the histogram’s green bars, suggesting that the rally may extend toward $3.00 soon.
Summary
SNX price attempted to surpass the upper trendline of $2.40. A breakout is expected soon. Moreover, the price action shows buyers are gaining traction and showing their muscles in front of the bears, and investors are gaining interest. Furthermore, the chart structure favors the bulls and suggesting follow-up buying, leading the stock toward the swing of $2.60 and will skyrocket soon.
Technical Levels
Support Levels: $2.10 and $2.00
Resistance Levels: $2.40 and $2.60
Disclaimer
The views and opinions stated by the author or any people named in this article are for informational purposes only, and they do not establish financial, investment, or other advice. Investing in or trading crypto or stock comes with a risk of financial loss.

With a background in journalism, Ritika Sharma has worked with many reputed media firms focusing on general news such as politics and crime. She joined The Coin Republic as a reporter for crypto, and found a great passion for cryptocurrency, Web3, NFTs and other digital assets. She spends a lot of time researching and delving deeper into these concepts around the clock, and is a strong advocate for women in STEM.


