
 Home
Home News
News

- 1 BitTorrent price (BTT) fell 0.32% in the last 24 hours and is currently trading at $00000041.
- 2 BitTorrent price (BTT) is declining forming a falling wedge pattern over the weekly timeframe.
The BTT price has been in a continuous declining trend losing most of the gains and forming new All-time lows. The price is in a continuous decline trend suffering multiple rejcetions from the key moving average of 200 EMA.

The daily chart shows that a strong bearish trend prevailing in the crypto as the price hit an all-time low a few days ago. Thereafter the price tried to surge but got detained from the 50-EMA and consolidated near the low.
The price prediction of the weekly chart shows that the price is trading in a falling wedge pattern and trading at the lower trendline of the wedge which might halt the price decline.
The year 2023 has not been a profitable year for the BTT investors as the crypto has experienced strong selling after a short-term hike of nearly 20% in January. Since then the price has lost more than 50% of its market capitalization and still declined to erode more.
BitTorrent Price Prediction Using Price Action Strategy
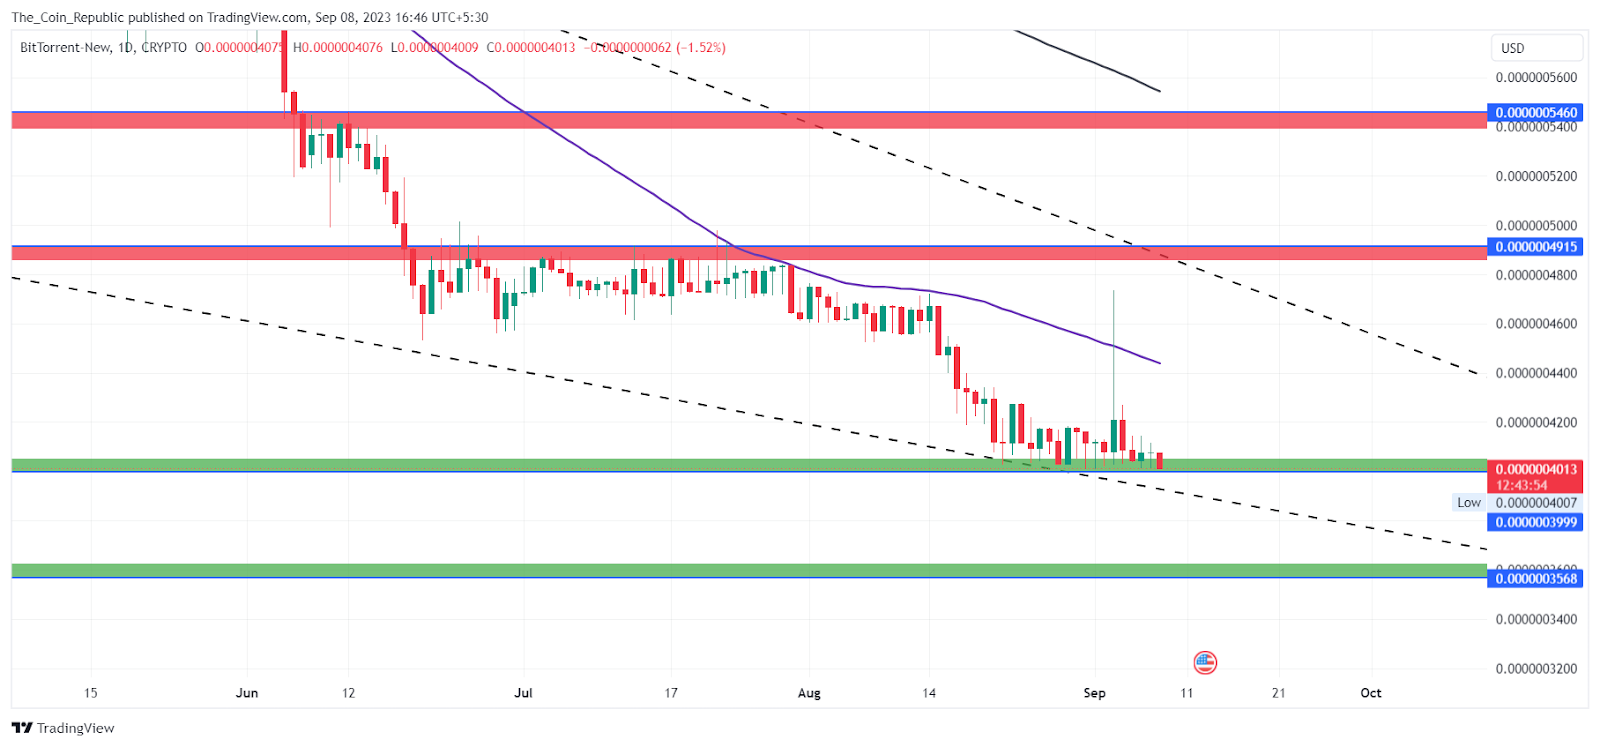
The analysts observe that the price trend may remain on the bearish side until it remains below the upper trendline of the falling wedge pattern. The price is consolidating at an all-time low and showing no signs of recovery.
The price may decline more as there is no major resistance to the lower side and the trend is totally in the control of bears.
Also, the volume analysis shows that the volume received is less than the average volume indicating the weakness in the market. The BTT token has received a $15.78 Million volume in the past 24 hours which is nearly 22% more than the past day.
BTT Price Forecast from Indicators’ point of view
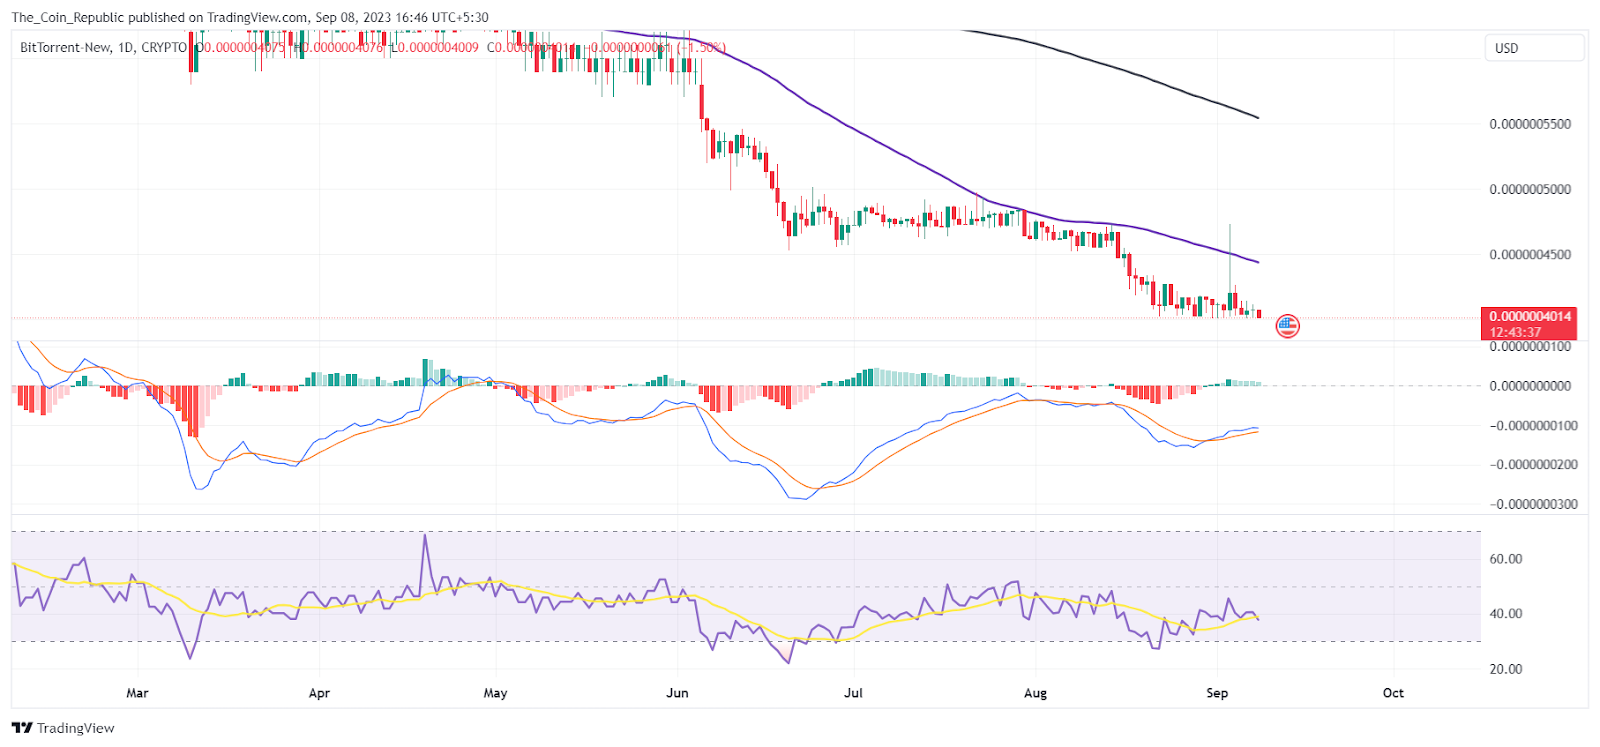
As per the EMA analysis, the BTT price is trading below the 50 and 200-day EMA indicating weakness over the charts. The price suffered multiple rejections from the key moving averages and declined. The EMAs are acting as a dynamic resistance for the price.
MACD lines have made a bearish crossover. Also, Histogram bars are being formed below the mean line with decreasing height indicating the bears losing momentum which might be a bullish sign for the investors.
Conclusion
BitTorrent (BTT Crypto) is a crypto that has been in a downtrend, hitting an all-time low and losing 50% of its market cap in 2023. The price is below the 200 EMA and the upper trendline of a falling wedge pattern, which are resistance levels. The price may drop more as there is no support on the lower side. The volume is low, showing weakness in the market. The MACD is bearish, but the histogram bars are decreasing, indicating a possible loss of momentum for the bears.
Technical Levels
- Support levels: $0.00000040 and $0.00000035.
- Resistance levels: $0.00000049 and $0.00000054.
Disclaimer
The views and opinions stated by the author, or any people named in this article, are for informational purposes only and do not establish financial, investment, or other advice. Investing in or trading crypto or stock comes with a risk of financial loss.
Mr. Pratik chadhokar is an Indian Forex, Cryptocurrencies and Financial Market Advisor and analyst with a background in IT and Financial market Strategist. He specialises in market strategies and technical analysis and has spent over a year as a financial markets contributor and observer. He possesses strong technical analytical skills and is well known for his entertaining and informative analysis of the Financial markets.


