
 Home
Home News
News
- 1 Duke Energy stock price closed at $89.40 while witnessing a gain of 2.18% during the last intraday session.
- 2 DUK stock price has slipped below all the major exponential moving averages.
- 3 The year-to-date return of Duke Energy Corporation is -13.37%.
Duke Energy (DUK) stock price has been in a strong downtrend since the start of 2023, falling from the high of $106.43. The stock price has been forming lower lows. Recently, DUK stock price formed support at $87.80 and initiated a bullish rally to retest $100 but the move was halted as the price reached near $96. The stock price faced strong rejection from $96 and melted down with higher momentum.
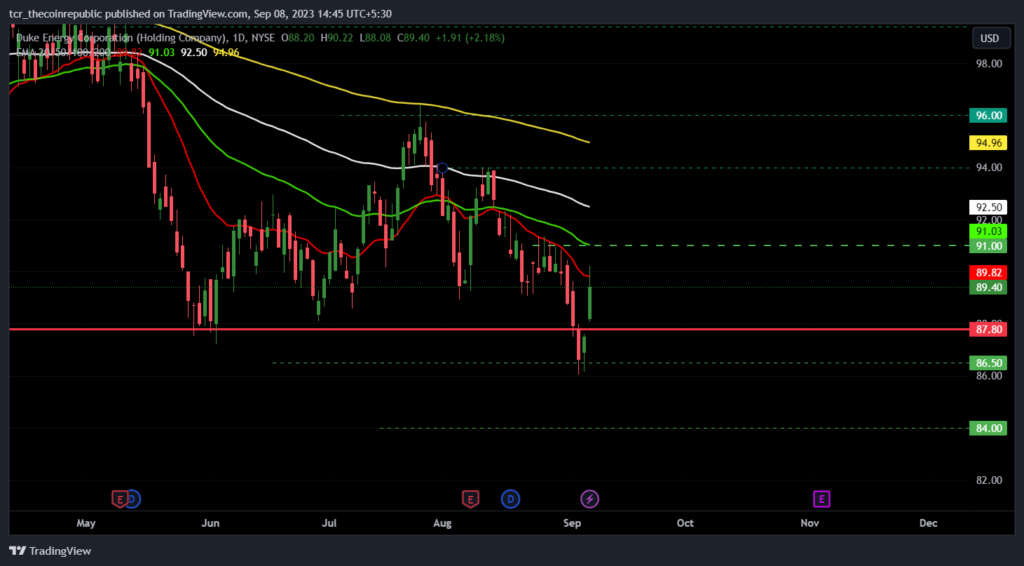
On September 5, the stock price broke the support level of $87.80 and was successful in closing below it. However, the DUK stock price formed support at $86.50, and the last candle re-entered the previous zone, turning the breakout into a fake out.

If the bullish momentum continues, Duke energy stock price might retest the $91 level and potentially shatter it to rise toward $94. On the other hand, if bearish momentum prevails and breaks the support level of $86.50, the price might melt down to $84.
Utilities Sector Slumps 13% In 2023
The utilities’ stock is not in vogue anymore. Companies that provide electricity, water, and gas are often embraced for their chunky dividend yields and tendency to hold up when the economy runs into a tumble.
The utility sector melted 13% in 2023 and is one of the worst-performing groups of the S&P 500. According to FactSet, the utility sector is trading at 15.9 times its expected earnings over the next 12 months below the 10-year average of 17.4. The tech sector has rallied 45% year-to-date as investors load up on AI bets.
Will DUK Stock Price Retest $100?
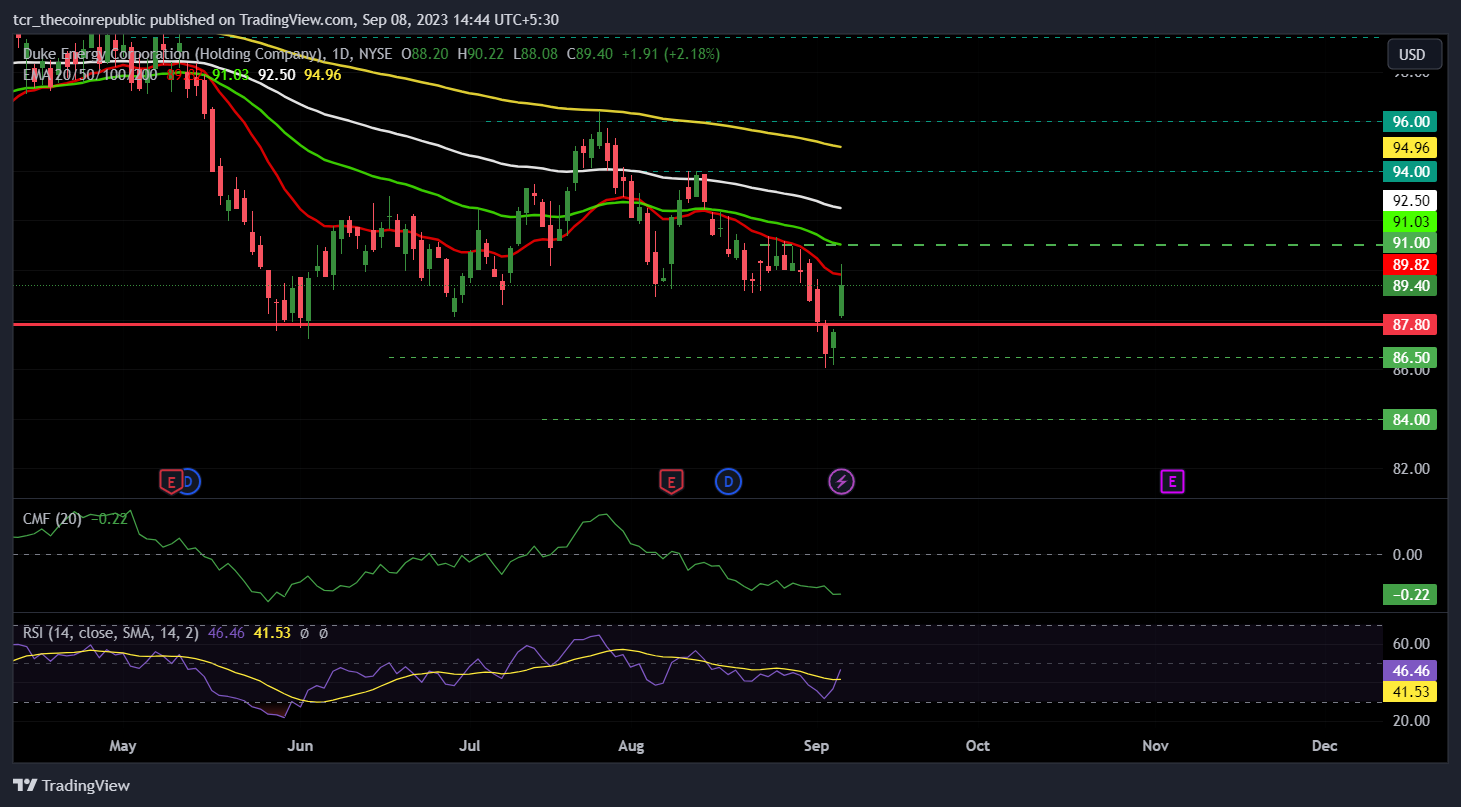
The stock price has tumbled below 20, 50, 100, and 200-day exponential moving averages, indicating bearish momentum. The Chaikin money flow score has been hovering below the 0 mark since 10 August and currently stands at -0.22, suggesting weakness and capital outflow from the market.
The relative strength index has begun its upward trajectory and stands at 46.46, hovering in neutral territory but showing a rise in bullish momentum. The last two candles show that the bulls have started to enter the market.
The Bollinger bands have also slightly expanded suggesting a rise in volatility. DUK stock price touched the lower band of Bollinger and experienced a short-term pullback.
Conclusion
The market structure and price action of Duke Energy Corporation have turned bullish after the stock price re-entered the previous zone. The technical parameters indicate that bulls are entering the market to protect prices from further downfall.
Technical Levels
- Major support: $86.50 and $84
- Major resistance: $91 and $94
Disclaimer
The views and opinions stated by the author, or any people named in this article, are for informational purposes only. They do not establish financial, investment, or other advice. Investing in or trading crypto assets comes with a risk of financial loss.

Andrew is a blockchain developer who developed his interest in cryptocurrencies while pursuing his post-graduation major in blockchain development. He is a keen observer of details and shares his passion for writing, along with coding. His backend knowledge about blockchain helps him give a unique perspective to his writing skills, and a reliable craft at explaining the concepts such as blockchain programming, languages and token minting. He also frequently shares technical details and performance indicators of ICOs and IDOs.


