
 Home
Home News
News
- 1 Astar (ASTR) price is up by 2.59% in the past 24 hours and is currently trading at $0.06.
- 2 Astar (ASTR) price is trying to sustain above the key moving average of 50-day EMA.
- 3 ASTR price forms a bullish pattern over the daily chart.
The price prediction of Astar over the weekly chart shows that the coin price bounced back from the lower levels and surged higher. The bulls have been continuously pushing the prices higher; defending the previous lows.
The daily charts show that the ASTR price seems to form a bearish flag pattern and is trading within the boundaries. The price is headed higher with the sellers dominating at the upper boundary and the buyers aggressive at the lower edge.
The technical indicators imply that the buyers are in domination in the short-term and continuously taking support from the 50 moving average. The RSI has been hovering in the upper zone indicating the dominance of the buyers. The ASTR token will require further buyer support to defend previous lows.
Astar Network is a web 3.0 platform that enables developers to create dApps and Layer-2 solutions with interoperability and scalability. It supports both EVM and WASM smart contracts, which can interact with each other on a parachain. Astar Network offers web 3.0 infrastructure, financial incentives, incubation programs, and technical support for developers.
Astar Price Forms Bearish Flag Pattern
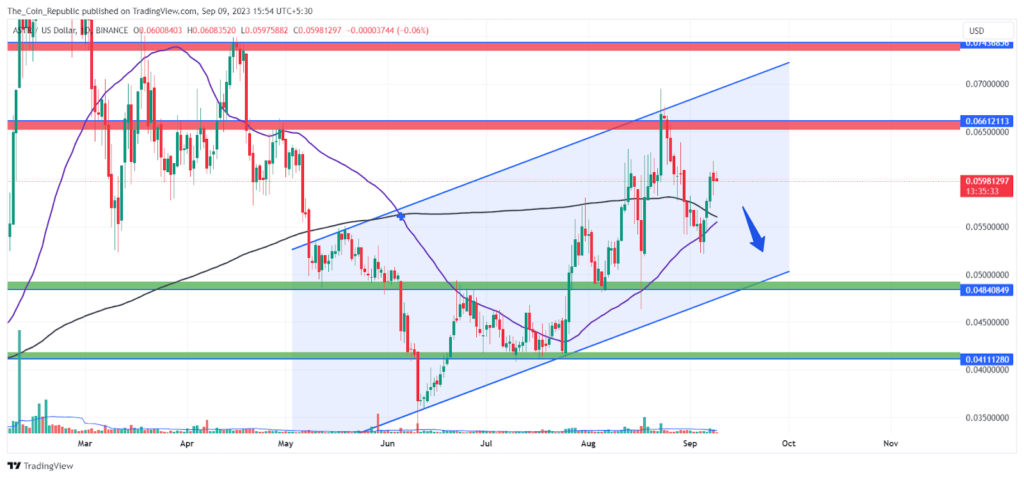
The Astar price is currently trading at $0.06 and headed upwards maintaining a bearish flag pattern over the daily chart.
Analysts say that the ASTR price might maintain itself in the channel getting support from the lower boundary. The price trend is positive until the crypto maintains itself in the channel.
However, the breakdown of the pattern may turn the short-term trend bearish and sellers might try to dominate the market and drag the price to lower levels.
Technical Indicators Showing Strength Over The Daily Chart

MACD lines are showing a bullish crossover. Also, histogram bars are being formed above the mean line indicating the crypto price might get more buying volume at CMP.
The EMA analysis shows that the ASTR price is rising taking multiple support from the 50 EMA; indicating the presence of the buyers at the lower levels.
At the time of publishing, the RSI value of the ASTR token is 56.89 and that of the SMA line is 48.36. RSI is headed upwards taking support from the SMA line indicating the dominance of buyers in the market.
Conclusion
The Astar price is rising from the lower levels, forming a bearish flag pattern on the daily chart. The price is trading within the boundaries, with sellers at the upper edge and buyers at the lower edge. The technical indicators show that the buyers are dominant in the short term and are supported by the 50-day moving average. The Astar price is at $0.06 and needs more buyers’ support to avoid a breakdown. A breakdown could lead to a bearish trend and lower levels. Astar’s price is positive but risky.
Technical Levels
- Support levels: $0.048 and $0.041
- Resistance levels: $0.066 and $0.075.
Disclaimer
The views and opinions stated by the author, or any people named in this article, are for informational purposes only and do not establish financial, investment, or other advice. Investing in or trading crypto or stock comes with a risk of financial loss.

Andrew is a blockchain developer who developed his interest in cryptocurrencies while pursuing his post-graduation major in blockchain development. He is a keen observer of details and shares his passion for writing, along with coding. His backend knowledge about blockchain helps him give a unique perspective to his writing skills, and a reliable craft at explaining the concepts such as blockchain programming, languages and token minting. He also frequently shares technical details and performance indicators of ICOs and IDOs.


