
 Home
Home News
News

- 1 Pepe price prediction suggests that the price is in a consolidation phase.
- 2 Pepe price (PEPE) is down 2.5% in the last 24 hours and it currently trades at $0.00000079.
Pepe price prediction indicates that bulls may drive momentum for a short while before taking another drawdown. Pepe price has started making doji and spinning top candlestick patterns after a decline, which indicates exhaustion in the selling pressure and the buyers might try to attempt to take over the game in their territory.
The daily chart also shows that the PEPE price has continuously been declining in the past 6 months losing the gains and declining further. The buyer’s attempt got converted to pullback each time and the price experienced a continuous drawdown.

The price of PEPE slumped almost 36% in August 2023, reaching the lower trendline of a channel pattern formed on the daily chart. Recently, the Pepe crypto has formed a new swing low after the breakdown of the previous one.
Pepe Price Prediction Using Price Action Strategy

The PEPE price currently trades at $0.00000079 and the price is facing difficulty holding above the previous low.
The price is consolidating at the lower levels and showing no signs of recovery till now. The breakdown of the consolidation may again show a drawdown in the price. The crypto price may experience a new swing low post the breakdown.
The PEPE coin has the dominance of sellers at the moment and the trend is favoring them. The buyers need to accumulate enough volume to counter the trend and reverse them.
PEPE Price Forecast From Indicators’ Point of View
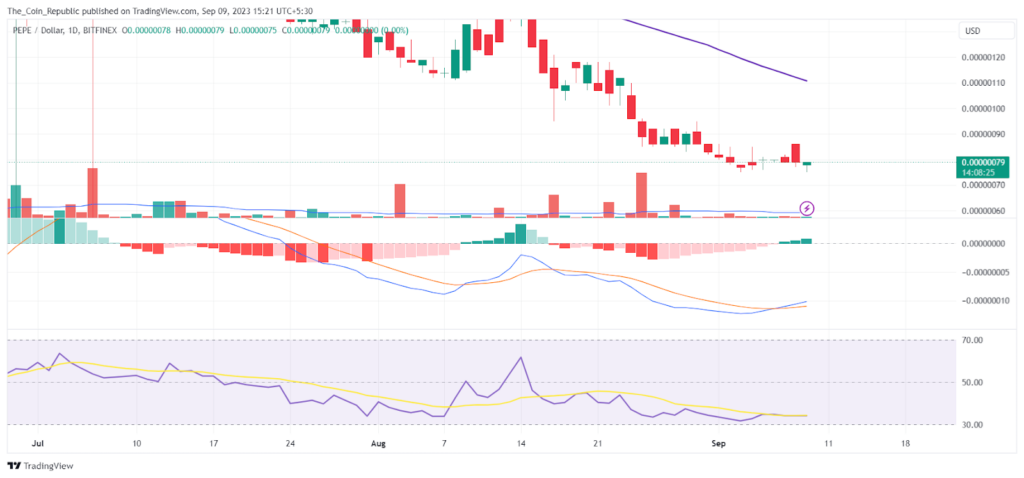
As per the EMA analysis, the PEPE price is trading below the key moving averages, 50 and 200 EMA, indicating bears dominating the trend.
The relative strength index (RSI) line is currently consolidating near the oversold level, positioned above the 14-day SMA. This suggests a potential negative crossover with the 14-day SMA, indicating a possible further decline in the price of PEPE in the near future. The present value of stochastic RSI is 33.69 points whereas the 14-day SMA is moving around 38.2 points.
MACD lines are showing a bullish crossover. Also, histogram bars are being formed above the mean line of negligible height indicating a consolidation in the crypto.
Conclusion
Pepe price is in a downtrend, forming lower lows and lower highs on the daily chart. The price has reached the bottom of a channel pattern and is consolidating at $0.00000079. The price shows exhaustion in selling pressure and may attempt a reversal. However, the breakdown of consolidation could lead to a new low. The sellers are dominant and the buyers need more volume to change the trend. Pepe’s price is struggling to recover and may face more decline.
Technical Levels
- Support levels: $0.00000078 and $0.00000040
- Resistance levels: $0.0000012 and $0.0000014
Disclaimer
The views and opinions stated by the author, or any people named in this article, are for informational purposes only and do not establish financial, investment, or other advice. Investing in or trading crypto or stock comes with a risk of financial loss.

Adarsh Singh is a true connoisseur of Defi and Blockchain technologies, who left his job at a “Big 4” multinational finance firm to pursue crypto and NFT trading full-time. He has a strong background in finance, with MBA from a prestigious B-school. He delves deep into these innovative fields, unraveling their intricacies. Uncovering hidden gems, be it coins, tokens or NFTs, is his expertise. NFTs drive deep interest for him, and his creative analysis of NFTs opens up engaging narratives. He strives to bring decentralized digital assets accessible to the masses.


