
 Home
Home News
News

- 1 General Mills, Inc. (GIS) stock declined over 20.51% in the YTD time frame.
- 2 In the 52 weeks time frame, GIS stock peaked at $90.89 and its lowest trading price was $64.70.
- 3 At the time of writing, GIS stock price was trading below 20,50,100 and 200 day EMAs.
GIS stock has been declining since the beginning of 2023. At the time of publication GE stock price was $66.15. It opened with a surge of 1.78% on the September 9 trading session.
In the 52 weeks time frame, GIS stock peaked at $90.89 and its lowest trading price was $64.70. General Mills, Inc. has a market capitalization of $38.445 Billion. Market cap declined by 22.24% compared to this time in 2022.

The MACD suggests that sellers are aggressive, the RSI line is penetrating deep inside the oversold territory. Significant sellers accumulation is seen below the histogram.
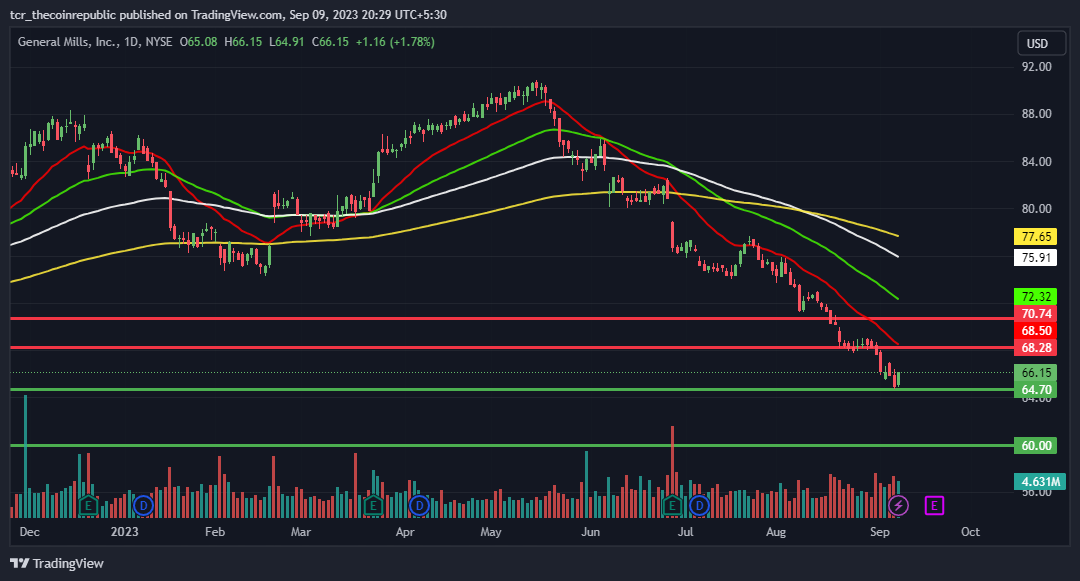
At the time of writing GIS stock price was trading below 20,50,100 and 200 day EMAs. In the weekly time frame, a decline of 19% was observed in the past three months and over the year, a decline of 12.80% was recorded.
General Mills, Inc. stock was trading below its annual price target of $76.24 which is around 15.25% greater than press time trading price. The dividend yield TTM was 3.34%, the company is yet to pay a dividend for August 2023.
General Mills, Inc. is engaged in the manufacture and marketing of branded consumer foods sold through retail stores. Its product categories include snacks, ready-to-eat cereal, convenient meals, pet food, refrigerated and frozen dough including others.
General Mills, Inc. Financial Updates
In 2022, General Mills, Inc. reported $20.09 Billion in revenue from which its gross profit was 34% and net income was positive 13%. According to TradingView, 579.152 Million GIS shares are free floating and 0.35% are closely held. Compared to 2021, profit margin and growth declined in 2022.
The company generates the majority of its revenue from the United States, North America, Canada and a few other countries. In the long term, total liabilities of the company are $13.72 Billion and assets of the company are $26.78 Billion.
Technical Levels
Support Levels: $64.70 & $90.89
Resistance Levels: $68.28 & $70.74
Conclusion
GIS stock seems to be losing bulls’ attention as it has been on a decline since the start of 2023, market capitalization followed suit.The MACD suggests that sellers are aggressive; the RSI line is steadily penetrating deep inside the oversold territory. The MACD histogram shows seller accumulation.
Disclaimer
The views and opinions stated by the author or any people named in this article are for informational ideas only and do not establish financial, investment, or other advice. Investing in or trading crypto assets comes with a risk of financial loss.

Nancy J. Allen is a crypto enthusiast, with a major in macroeconomics and minor in business statistics. She believes that cryptocurrencies inspire people to be their own banks, and step aside from traditional monetary exchange systems. She is also intrigued by blockchain technology and its functioning. She frequently researches, and posts content on the top altcoins, their theoretical working principles and technical price predictions.


