
 Home
Home News
News

- 1 Stellar price is currently trading at $0.129088 with a rise of 1.77% in the last 24 hours.
- 2 XLM has a current market cap of $3.544 Billion.
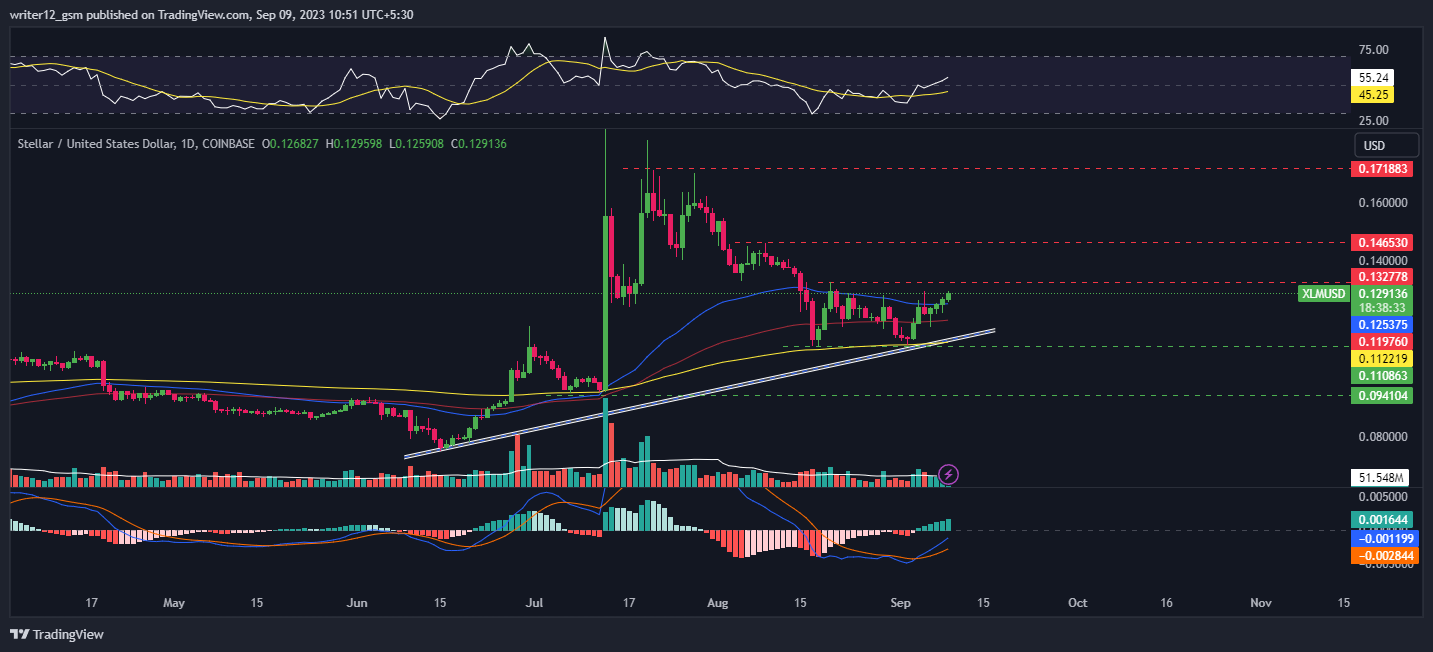
- 3 XLMUSD showed bullish momentum in previous trading sessions.
Stellar price action is showing bullishness, as XLM continues to hold the gains in the bullish territory and neglect the rejections. However, mighty bears continue to make short positions and try for a corrective move in the.

XLMUSD showcased bullishness and persisted in holding the gains over the top. Bulls are accumulating and preparing to surpass $0.146 in the following sessions.

Furthermore, the chart formation indicates bulls’ momentum and signals a positive outlook on the charts. However, XLM is trying to register a breakout soon, and investors have kept an eye on it.
The price action shows a strong chart structure with buyers’ dominance, and long buildup activity was noted in the past trading sessions. Furthermore, sellers were now becoming cautious due to the vertical rally that trapped sellers in the past weeks.
Stellar’s price was at $0.129088 and gained 1.77% of its market capitalization during the day’s trading session. The last 24-hour trading volume was 21.943 Million and the last 10 days’ average trading volume is 54.164 Million. This demonstrates that buyers are trying to accumulate in order to surge toward the upper price range.
Technical Analysis: Will Stellar Price Continue to Surge High?
Stellar (XLMUSD) has steadily seen its price rise for the past three months, gaining 57.16% and 13.32% in the last week. Currently, XLM crypto is trading at $0.129088 and has been trying to hold on to this level after an unexpected surge in price.
If it can keep this level, the XLMUSD price could continue to go up and reach the first and second targets of $0.142853 and $0.170826. However, if the XLM price cannot maintain this level and falls, then it might hit the closest support levels of $0.098853 and $0.082826.
Currently, Stellar is trading above the 50 and 200-day EMAs (Exponential moving averages), which are supporting the price momentum. Nonetheless, if buying volume adds up, then the price might support bullish momentum by making higher highs and new highs. Hence, the XLMUSD price is expected to move upward giving bullish views over the daily time frame chart.
The MACD line at -0.001121 and the signal line at -0.002826 are heading towards the zero line. A bullish crossover is observed in the MACD which signals strength in the momentum of the XLM price. The current value of RSI is 56 points. The 14 SMA is above the median line at 45 points which indicates that XLMUSD is bullish.
Summary
Stellar technical oscillators also support the bullish trend. The MACD, RSI, and EMA are emphasizing positive signs and imply that the uptrend may continue in the XLM price. Price action suggests that the investors and traders are bullish on the 1-Day time frame.
Technical Levels
- Support Levels: $0.098853 and $0.082826.
- Resistance Levels: $0.142853 and $0.170826.
Disclaimer
The analysis provided in this article is for informational and educational purposes only. Do not rely on this information as financial, investment, or trading advice. Investing and trading involve risk. Please assess your situation and risk tolerance before making any investment decisions.

Adarsh Singh is a true connoisseur of Defi and Blockchain technologies, who left his job at a “Big 4” multinational finance firm to pursue crypto and NFT trading full-time. He has a strong background in finance, with MBA from a prestigious B-school. He delves deep into these innovative fields, unraveling their intricacies. Uncovering hidden gems, be it coins, tokens or NFTs, is his expertise. NFTs drive deep interest for him, and his creative analysis of NFTs opens up engaging narratives. He strives to bring decentralized digital assets accessible to the masses.


