
 Home
Home News
News
- 1 DASH price has been in a narrow range in the past few trading sessions.
- 2 Buyers are failing to attain strength and persist in facing selling pressure.
DASH price action indicates neutrality and is trying to surpass the 20-day EMA. Moreover, the price action shows sellers’ strong muscles and profit booking was witnessed on the charts. Furthermore, the chart structure shows a falling wedge pattern, and the price trading near the mid-Bollinger band suggests neutrality. Moreover, the DASH price is attempting to gain traction and is looking for a bounce but has faced a 20-day EMA barrier and hovers below the cluster of $30 for the past weeks.
If it surpasses $30, the DASH price will gain traction and exceed momentum toward a further swing of $40 soon. Moreover, the price is close to the demand zone and the value area, favoring a bounce, and may retest the upper trendline of $28 in the upcoming sessions. However, the sellers maintained the range and did not permit bulls to win the battle.

DASH price is trading below the significant moving averages. The technical parameters suggest a negative outlook, and follow-on selling may lead to the immediate support of $20 being retested. The lower trajectory of DASH is near $20, which, if it breaks, a fresh selloff can be seen, whereas if the price surpasses $30, bulls exceed momentum and capture the upper trajectory of $40.
At press time, DASH price is trading at $25.98 with an intraday drop of 1.30%, showing neutrality on the charts. Moreover, the trading volume increased by 11.22% to $16.22 Million, and the pair of DASH/BTC is at 0.00100 BTC. However, the market cap of DASH is $298.79 Million. Moreover, analysts maintained a neutral rating and suggested volatility for the upcoming sessions.
DASH Price Action Shows Negative Outlook On Daily Charts
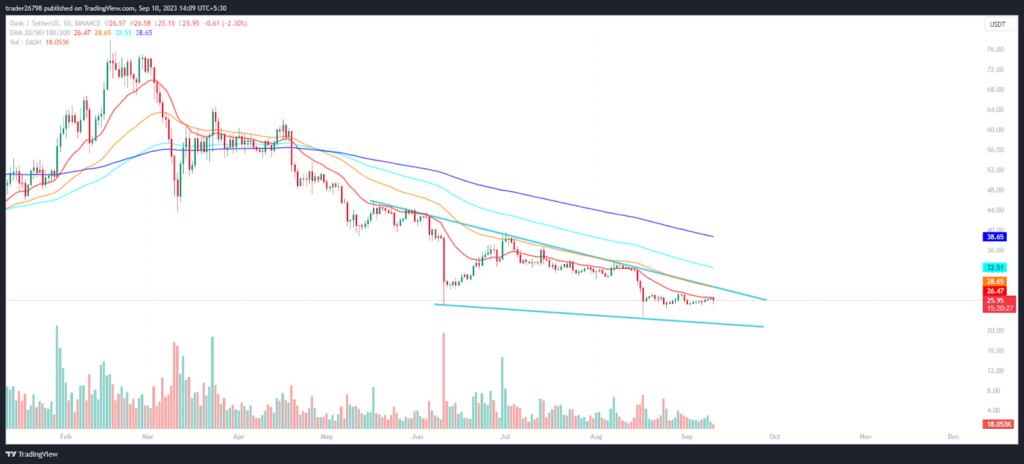
On the daily charts, the DASH can be seen losing gains in a correction phase. It is hovering near the support region of $25. Furthermore, the price action favors the sellers. A short buildup activity was witnessed in the past sessions. Furthermore, the DASH price has slipped below neutrality and is heading toward the 38.3% Fib zone.
Short Term Charts Shows Rejection Wick Near Support
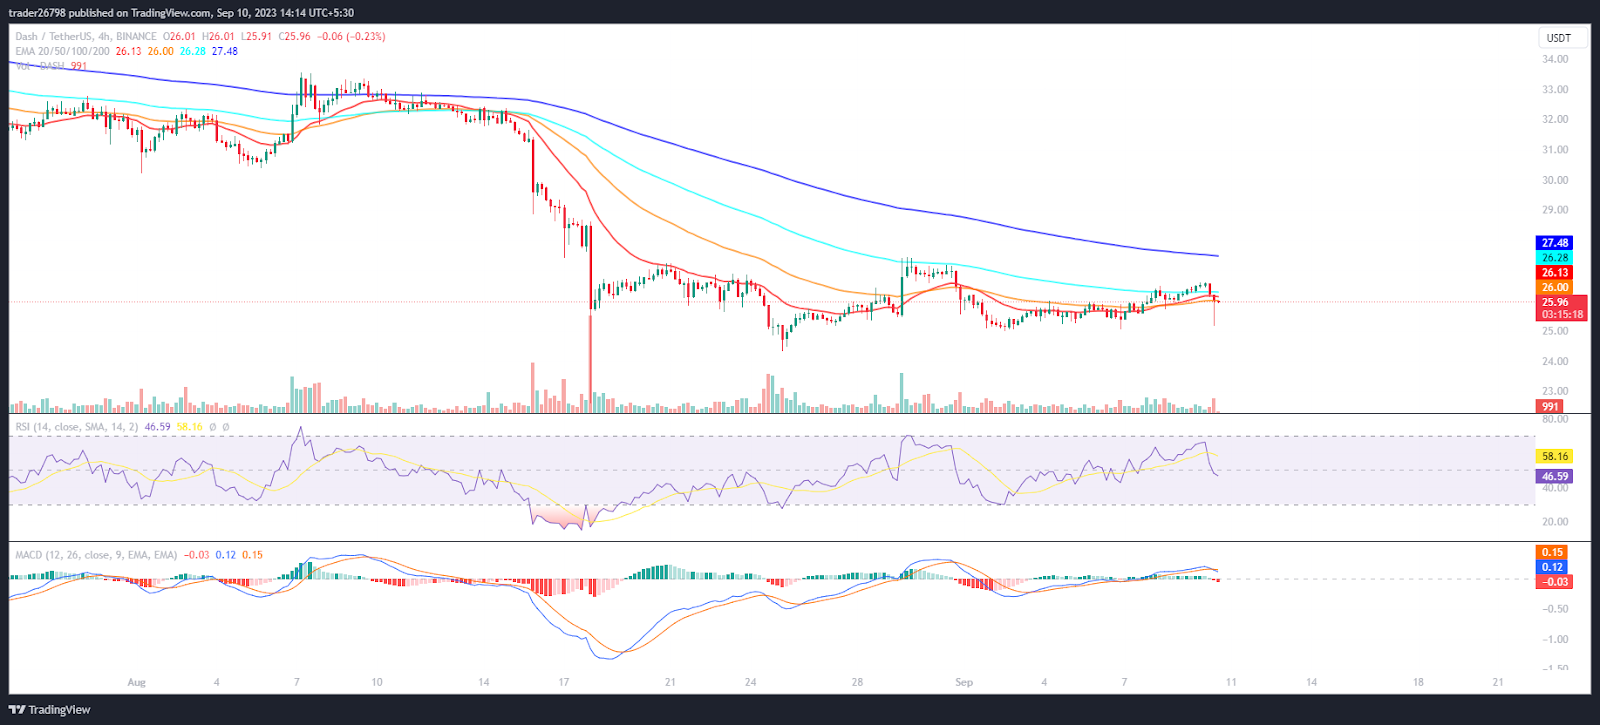
On the 4-hour charts, the DASH price chart shows bearishness. It is trading below the cluster of $30 due to profit booking in the past sessions. Moreover, the technicals suggest a follow on selling and revisit the swing near $20.
The RSI curve stayed near neutrality, showing a bearish divergence and forming a negative crossover, indicating a volatile chart structure.
The MACD shows a bearish crossover with formed red bars on the histogram, suggesting that bears are attempting to break the immediate support of $20.
Summary
DASH price shows a bearish chart structure and indicates seller dominance in the past sessions. Furthermore, the price action and technicals suggest a negative outlook, and DASH may slip toward $20 soon. Conversely, if the crypto attains momentum, a rebound toward $30, followed by $35, can be seen in the upcoming sessions.
Technical Levels
Support Levels: $20 and $15
Resistance Levels: $30 and $40
Disclaimer
The views and opinions stated by the author or any people named in this article are for informational purposes only, and they do not establish financial, investment, or other advice. Investing in or trading crypto or stock comes with a risk of financial loss.
Steve Anderson is an Australian crypto enthusiast. He is a specialist in management and trading for over 5 years. Steve has worked as a crypto trader, he loves learning about decentralisation, understanding the true potential of the blockchain.


