
 Home
Home News
News
- 1 The year-to-date return of KBR, Inc. is 13.30% while the three-month return is 5.21%
- 2 KBR stock price trades above the 100 and 200-day EMA, looking good in the long term but faced rejection in the short term and moved below 20 and 50 EMA.
- 3 Kbr Inc. (NYSE: KBR) stock’s 52-week price range is around $41 – $65.
KBR, Inc. is a professional services company that offers good value based on its Price-To-Sales Ratio. Its ratio of 1.2x is equal to the industry average and lower than the fair value of 1.7x. KBR is expected to turn profitable in 3 years, which is faster than the savings rate of 2.2%.
KBR’s revenue growth of 12.7% per year is higher than the US market growth of 7.7% per year. KBR’s debt and interest payments are well covered by its cash flow (26.9%) and EBIT (4.7x). KBR’s management team has an average tenure of 5.1 years, indicating experience and stability. This information is based on the analysis from Simply Wall St., a financial website.

KBR Inc. has a strong buy rating from 12 analysts on TradingView who rated it in the last three months. About 11 analysts who gave a 1-year price forecast for KBR Inc. projected a high of $77 and a minimum high of $71.
KBR stock has been rising since the beginning of 2023 and has shown buyer accumulation. The stock encountered a barrier near the supply range and retracement in the previous sessions and may decline more to form a support around fibo 38.20% level in the short term.
KBR’s stock price was at $59.82 with an intraday decrease of 0.42%. Moreover, the intraday trading volume of KBR is 1.548 Million more than the 10-day aggregate volume of 935.592K. The stock has a market cap of $8.071 Billion and floating shares are 133.323 Million.
Based on recent data, the revenue of the period ending in June 2023 was $1.753 Billion and it missed analyst estimates by 0.09%. Moreover, the KBR stock estimated EPS was 0.718, and the reported EPS was 0.74 which gave a positive surprise of 3.04%.
Technical Analysis of KBR Stock Price in 1-D Timeframe
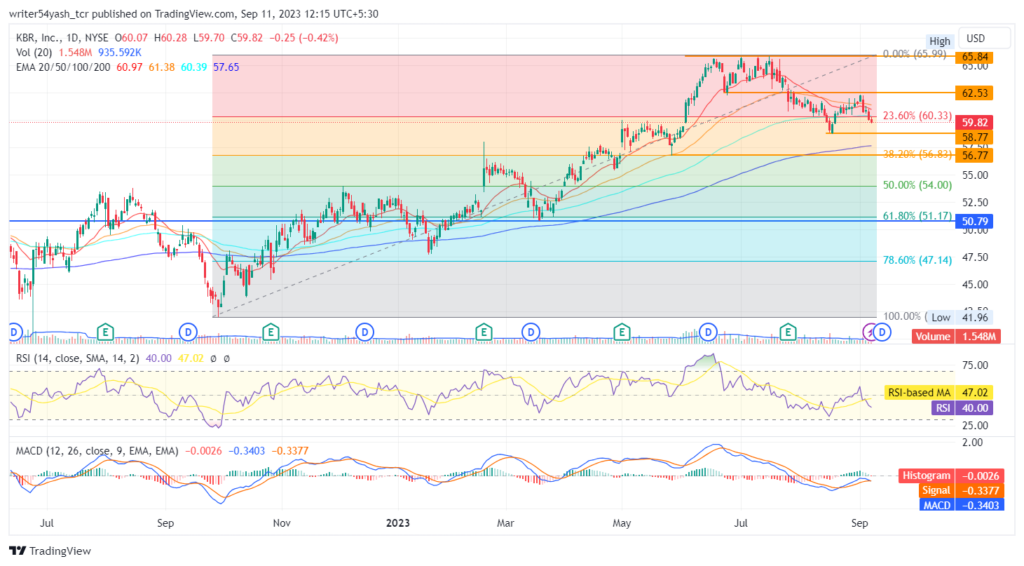
KBR was in a bullish trend since September last year even before 2023 started. The KBR price found support around $41 and was strongly bought. From the low of $41 to the high of $65, the journey was strong and moved upwards by making higher highs and lows, the yearly high was reached by July 18th, 2023. Moreover, the price moved along the Fibonacci levels and rose steadily from these Fibo levels.
At the time of writing, the price was $59.82 and has faced some resistance after the quarterly results. The price has dropped to the 23.60% Fibonacci level as some investors booked their profits. The price may fall further to the 38.20% Fibonacci level, where it may find some support at $56. Since the stock is fundamentally strong, it may try to rebound from there and resume its upward movement.
The current stock price of KBR stock might achieve more, there is a possibility for the price to move toward the next resistance level of $62 and $65.
On the other hand, if the price breaks below the $58 significant support level, it might fall toward $56 and beyond.
At the time of publishing, KBR Inc. (NYSE: KBR) stock is still above the 100 and 200 EMA, indicating a long-term bullish trend. However, the stock fell below the 20 and 50-day EMA, showing short-term bearish pressure.
The RSI is around 40, which means the stock is losing momentum and may be oversold. The MACD has crossed below the signal line, giving a bearish signal on the charts.
Summary
Kbr Inc. (NYSE: KBR) indicates that the traders and investors of the stock price are bearish in the short trend and bullish in the long trend on the 1-D time frame. The price is showing signs of weakness and may drop to $56, where it may find some support. The technical indicators of KBR stock price also confirm the short-term downtrend. The EMA, RSI, and MACD are all pointing downward, indicating a lack of momentum and buying pressure. However, the company has strong fundamentals and may recover in the long-term outlook.
Technical Levels
Support levels: The nearest support levels for KBR price are $58 and $56.
Resistance levels: The nearest resistance levels for the KBR stock price are $62 and $65.
Disclaimer
In this article, the views and opinions stated by the author, or any people named are for informational purposes only, and they don’t establish the investment, financial, or any other advice. Trading or investing in cryptocurrency assets comes with a risk of financial loss.

Nancy J. Allen is a crypto enthusiast, with a major in macroeconomics and minor in business statistics. She believes that cryptocurrencies inspire people to be their own banks, and step aside from traditional monetary exchange systems. She is also intrigued by blockchain technology and its functioning. She frequently researches, and posts content on the top altcoins, their theoretical working principles and technical price predictions.


