
 Home
Home News
News
- 1 The Bitcoin Cash crypto’s price took resistance and decreased by 1.57% over the last week.
- 2 The price of the BCH crypto is trading at $190.90 and the 52-week range is $91 – $327.
Bitcoin Cash (BCH)’s maximum possible market cap is $4,019,087,096, assuming that all 21 Million BCH tokens are already issued. This is called the fully diluted valuation (FDV) of BCH. However, the actual number of BCH tokens in circulation at press time may be lower, depending on how they are released over time. This data is from Coingecko, a website that provides information and analysis on cryptocurrencies.
Bitcoin Cash crypto surged by 0.84% in market value and surged by 73.75% in trading volume in the last 24 hours, per Coinmarketcap which is a crypto data and info website. Its market value is $3,728,788,640 and its trading volume is $215,426,075. There are 19,501,888 BCH in circulation.
Technical Analysis of BCH on 1-D Time Frame
BCH crypto price showed a downward trend for the past month, decreasing by 17.02% during this period and the price fell by making lower lows and highs.
At the time of publication, the BCH crypto price is trading at $190.90 and facing resistance from the trendline.
Therefore, the BCH crypto price could continue to move downwards and reach the nearest support at $186.25 and $168.09 if BCH fails to sustain the current level.
However, if the BCH crypto price sustains the current level and rises, then it might hit the nearest resistance levels of $220.01 and $249.79.
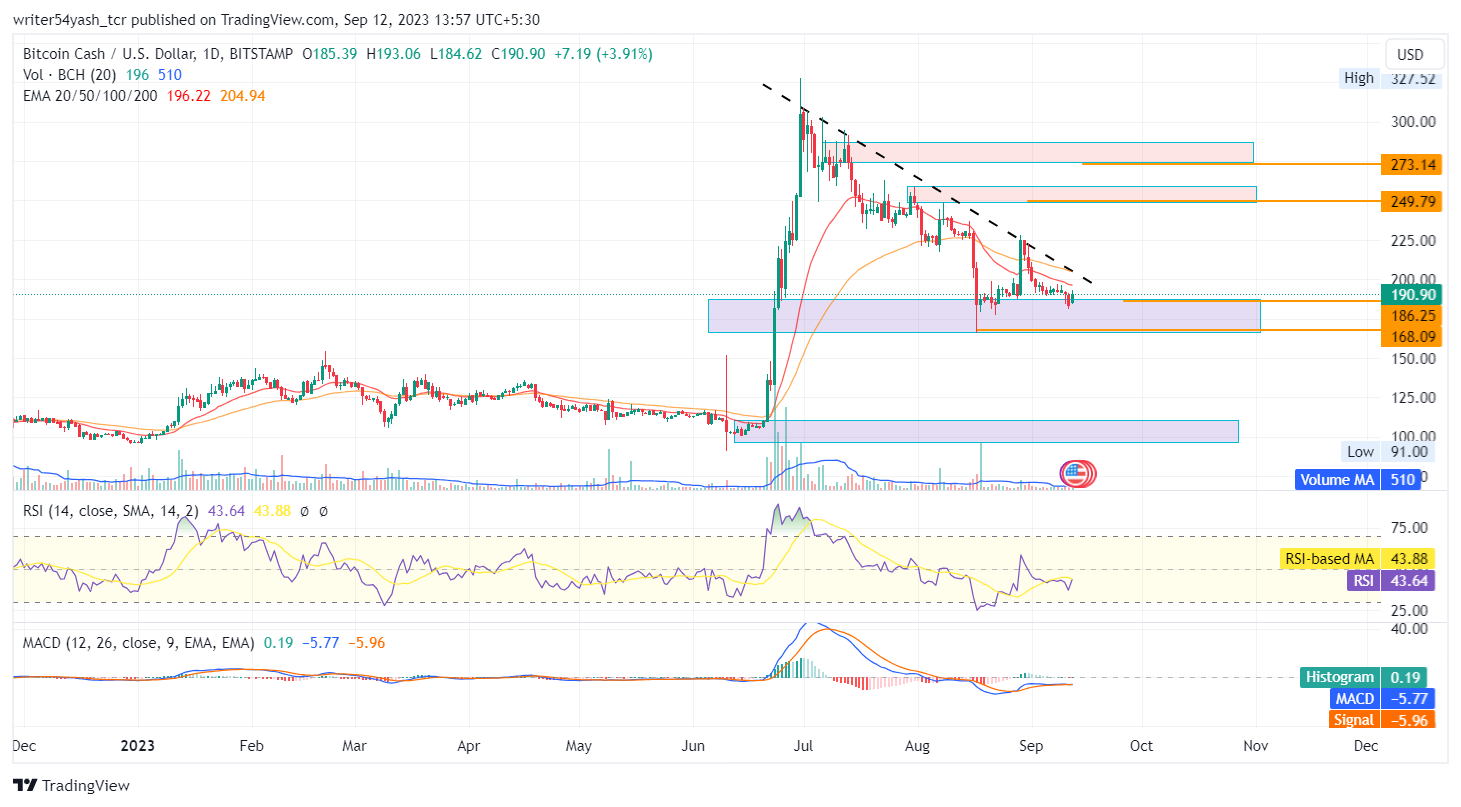
At the time of publishing, the BCH crypto price (BCH) is trading below the 20 and 50-day EMAs (exponential moving averages), which are rejecting the BCH crypto price trend.
The MACD line at 5.77 and the signal line at 5.96 are above the zero line and both lines crossed each other but the gap is lean in the MACD oscillator. The current value of the RSI is 43 points and the 14-day SMA is below the median line at 43.88 points. Collectively, the indicators view has consolidation to bearish.
Conclusion
The BCH crypto price prediction shows a neutral to negative outlook from investors and traders in the daily time frame. Bitcoin Cash price action reveals a neutral to downward trend at the time of writing. Moreover, the daily chart shows that the price might either consolidate or keep going down as per technical indicators like RSI, EMA, and MACD.
Technical Levels
- Support levels: The nearest support levels are $186.25 and $168.09
- Resistance levels: The nearest resistance levels are $220.01 and $249.79
Disclaimer
In this article, the views and opinions stated by the author, or any people named are for informational purposes only, and they don’t establish the investment, financial, or any other advice. Trading or investing in cryptocurrency assets comes with a risk of financial loss.

Nancy J. Allen is a crypto enthusiast, with a major in macroeconomics and minor in business statistics. She believes that cryptocurrencies inspire people to be their own banks, and step aside from traditional monetary exchange systems. She is also intrigued by blockchain technology and its functioning. She frequently researches, and posts content on the top altcoins, their theoretical working principles and technical price predictions.


