
 Home
Home News
News
- 1 Ethereum crypto’s price took resistance and decreased by 14.81% over the last month.
- 2 The price of the ETH crypto is trading at $1580.2 and the 52-week range is $1071 – $2140.
Vitalik Buterin, who co-founded Ethereum, may have a plan for his ETH holdings, according to Spotonchain; a community on CoinMarketCap which is the crypto analysis website. He might deposit more ETH to Bitstamp, a crypto exchange platform, based on his wallet and transaction analysis. His move could have various effects such as increasing liquidity, reducing volatility, or preparing for a major announcement.
Ethereum crypto plummeted by 2.04% in market value and surged by 89.94% in trading volume in the last 24 hours as per CoinMarketCap which is a crypto data and information website. Its market value is $189,854,788,251 and its trading volume is $8,707,931,879. There are 120,221,729 ETH in circulation.

Technical Analysis of ETH on 1-D Time Frame
ETH has been on a rising trend since November 2022 even before 2023 began. The ETH price found strong support around $1070 and was bought heavily at that time. The price climbed steadily without breaking the trendline from $1070 to $2140, reaching the yearly high by April 16th, 2023. The price also followed the Fibonacci levels and respected them effectively as seen on the charts.
However, the ETH turned bearish by April 19th and broke the most important trendline that it was following faithfully on August 17th, 2023. The current market price is between the Fibo 50.00% and 61.80% level trying to hold but it slipped below the previous low. The market character will change due to this and turn the overall trend bearish as well.
Therefore, to continue its uptrend, the price must treat this as a pullback and then it might rise up or beyond resistance levels of $1665 and $1735.
However, if the price falls below the previous low then the change of character might lead to a downfall and the supports will be $1490 and $1397.
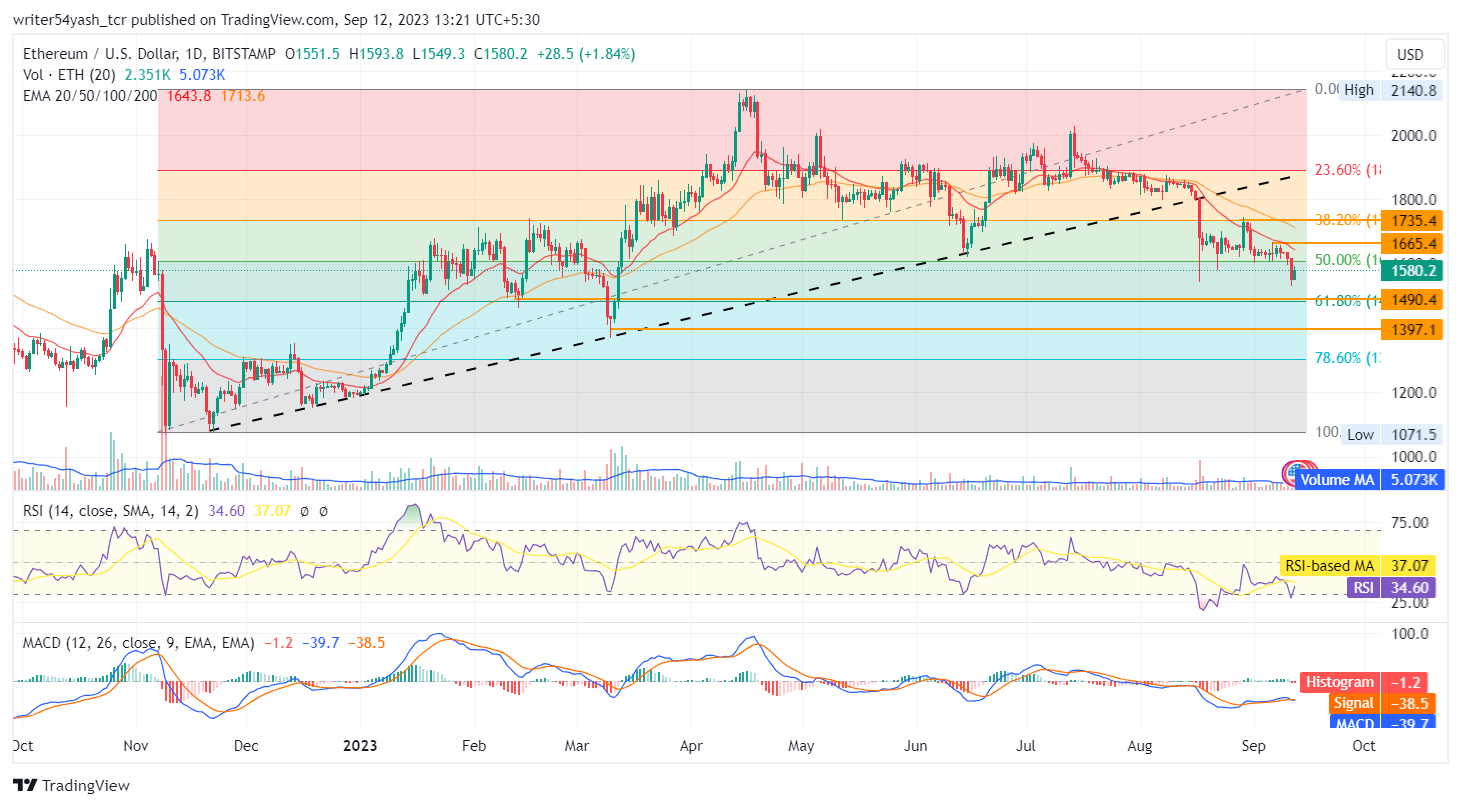
At the time of publishing, Ethereum (ETH) is trading below the 20 and 50-day EMA, showing positive signs on daily charts. RSI is around 34, and below the neutral line whereas MACD indicates bearishness to consolidation as the gap is lean. Collectively, the indicators say that the prices may consolidate with a bearish bias.
Conclusion
The ETH crypto price prediction shows a neutral to negative outlook from investors and traders in the daily time frame. Ethereum price action reveals a neutral to downward trend at the time of writing. Moreover, the daily chart shows that the price might either consolidate or keep going down, according to the RSI, EMA, and MACD.
Technical Levels
- Support levels: The nearest support levels are $1490 and $1397
- Resistance levels: The nearest resistance levels are $1665 and $1735
Disclaimer
In this article, the views and opinions stated by the author, or any people named are for informational purposes only, and they don’t establish the investment, financial, or any other advice. Trading or investing in cryptocurrency assets comes with a risk of financial loss.

Andrew is a blockchain developer who developed his interest in cryptocurrencies while pursuing his post-graduation major in blockchain development. He is a keen observer of details and shares his passion for writing, along with coding. His backend knowledge about blockchain helps him give a unique perspective to his writing skills, and a reliable craft at explaining the concepts such as blockchain programming, languages and token minting. He also frequently shares technical details and performance indicators of ICOs and IDOs.


