
 Home
Home News
News
- 1 Apecoin price shows a falling channel and persists in dragging the gains.
- 2 Buyers are losing their strength and feeling hopeless, according to the past sessions.
Apecoin price shows a falling channel and is now trading below the significant moving averages, showing bearishness on the charts. From the start of 2023, APE price persisted in dragging and is now losing over 80%, showing a massive plunge over the past months. Furthermore, Apecoin price action shows lower investor interest, and sellers continued to gain traction and persist in adding short positions for the past sessions.
Apecoin price is trading near the upper trendline of the falling channel but failing to surpass and continuing to drop for the past sessions. Moreover, the chart structure suggests that this plunge might reach toward the demand zone of $1.000 soon. However, APE price is signalling oversold data, and a bounce toward $1.200 can be seen where bulls have the challenge to extend the gains beyond the trendline of $1.300. If the APE price sustains near $1.100, a short covering move toward the 20-day EMA can be seen in the following sessions.
At press time, APE price is trading at $1.144 with an intraday gain of 0.97%, showing buyers’ efforts to surpass the 20-day EMA hurdle. Moreover, the trading volume increased by 10.07% to $46.52 Million, and the market cap is $150.41 Million. However, the pair of APE/BTC is at 0.0000438 BTC. Moreover, Analysts maintained a sell rating and suggested a further downfall for the following sessions.
APE Price Chart Shows the Falling Pattern
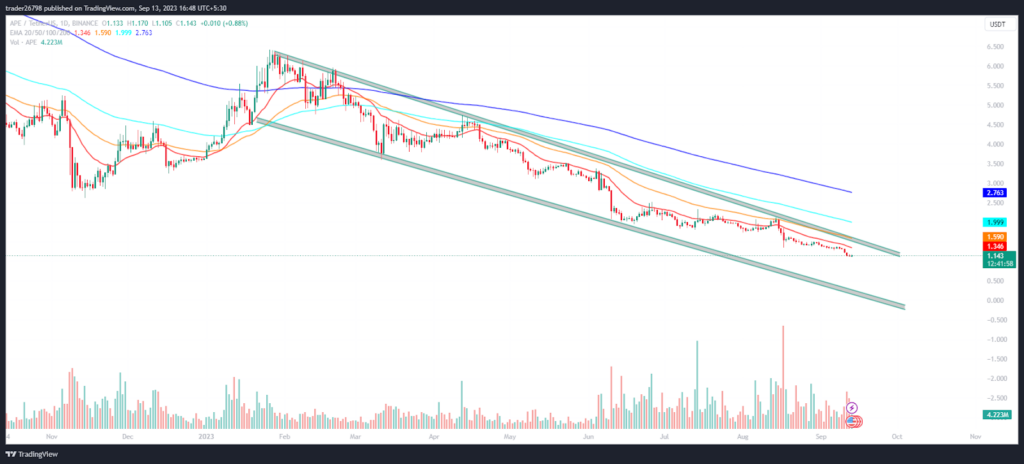
On the daily charts, Apecoin price shows a falling channel and persists in dragging the gains below the key moving averages. Apecoin signals a bearish chart structure and could not heal in the past months and was in the bear trajectory signalling selling pressure for the past weeks. Ape has deployed its strength and initiated a fresh selloff in the past sessions, indicating bearishness.
Is Apecoin Preparing For a Reversal?
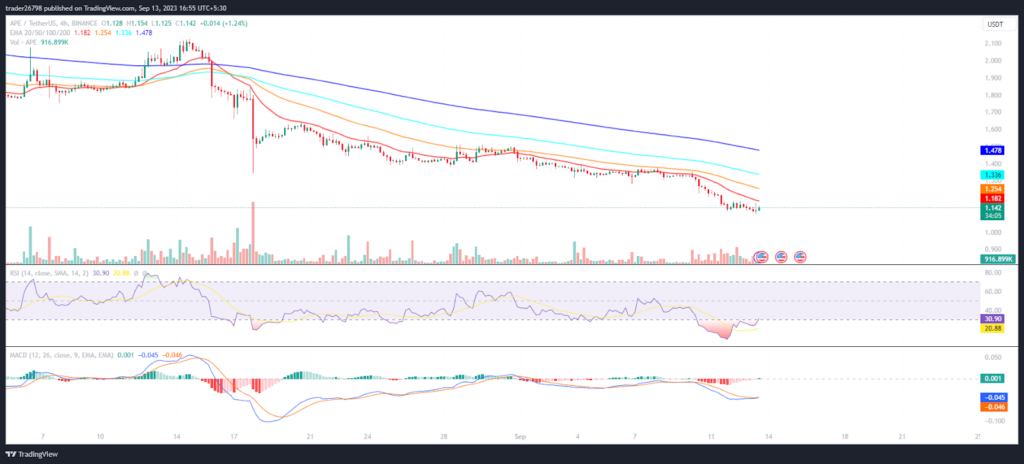
On the 4-hour charts, Apecoin price is holding the selloff and is trying to initiate a reversal. The morning star candlestick followed by a doji candle on the chart indicates that buyers are attempting a pullback.
The RSI curve is in the oversold region and formed a negative crossover, suggesting a negative outlook on the charts.
The MACD will likely initiate a bullish crossover, while the MA line close to the signal line suggests an upcoming bounce.
Summary
Apecoin price is trading below the cluster of $1.500 and has shown bearishness over the past months. Moreover, the chart structure shows seller dominance and a decisive setback in the past months.
Furthermore, if the price fails to hold the gains near $1.150, a further selloff will retest the primary support zone of $1.050, followed by $1.000.
Technical Levels
Support Levels: $1.100 and $1.000
Resistance Levels: $1.300 and $1.500
Disclaimer
The views and opinions stated by the author or any other person named in this article are for informational purposes only and do not constitute financial, investment, or other advice. Investing in or trading crypto or stocks comes with a risk of financial loss.

Andrew is a blockchain developer who developed his interest in cryptocurrencies while pursuing his post-graduation major in blockchain development. He is a keen observer of details and shares his passion for writing, along with coding. His backend knowledge about blockchain helps him give a unique perspective to his writing skills, and a reliable craft at explaining the concepts such as blockchain programming, languages and token minting. He also frequently shares technical details and performance indicators of ICOs and IDOs.


