
 Home
Home News
News
- 1 Bitcoin SV crypto price decreased by 1.27% over the last seven days.
- 2 Bitcoin SV crypto price is currently trading at $31.27 with a rise of 1.24% in the last 24 hours with a market cap of $602.615 Million.
Bitcoin SV price is down by -12.28% over the past month. According to the price action, the BSV price continues to move under the bears’ influence. Sellers are trying to pull Bitcoin SV crypto price toward the lower trendline. Bitcoin SV must attract buyers in order to surge toward the upper trendline. Investors in Bitcoin SV crypto need to wait for any directional change over the daily time frame chart.

Bitcoin SV crypto price is currently trading at $31.27 with a hike of 1.24% in the last 24 hours and a current market cap of $602.615 Million. BSV crypto needs to attract buyers in order to reach the recovery level. However, trading volume has been below average and needs to grow for the Bitcoin SV crypto price to sustain at a higher level.

Meanwhile, BSV crypto is trying to surpass below 20, 50, 100, and 200-day daily moving averages. Bitcoin SV price has lost -13.64% in a month and rose 27.57% in the last three months. Moreover, the BSV price has plunged around -13.51% in the last six months and has lost -25.32% year to date. This confirms the facts regarding BSV crypto’s bearishness in upcoming sessions.
Technical Analysis of Bitcoin SV Crypto Price in 1-D Timeframe
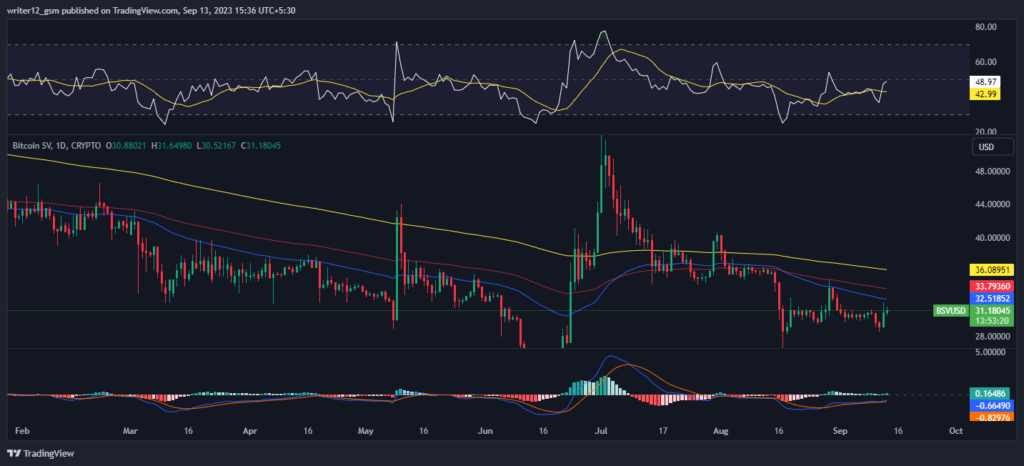
If it can keep this level, the Bitcoin SV price could continue to go up and reach the first and second targets of $32.72271 and $38.91753. However, if the BSV price cannot maintain this level and falls, then it might hit the closest support levels of $25.07935 and $18.88453.
At the time of publishing, Bitcoin SV crypto (BSV) is trading above the 50 and 200-day SMAs (Simple moving averages), which supports the price trend.
However, if more selling volume adds up then the price might conquer supporting SMAs by making lower highs and lows. Hence, the BSV price is expected to move downwards giving bearish views over the daily time frame chart.
Technical indicators suggest the downtrend momentum of the BSV crypto price. The relative strength index showcases the downtrend momentum of Bitcoin SV crypto. RSI was at 49 and is heading towards the neutral to be oversold.
MACD exhibits the downside trend of BSV crypto price. The MACD line is below the signal line after a negative crossover. Investors in BSV crypto need to wait for any directional change over the daily time frame chart.
Summary
The daily time frame chart of the Bitcoin SV cryptocurrency shows a dropping trend according to the BSV price projection from the upper level. In order for BSV cryptocurrency to rebound and reach the upper levels it must need the buyer’s support. Indicators suggest BSV is in a downturn. Before making the next move, investors should look at the daily time frame chart for any signs of change in direction and avoid being driven by fear or greed.
Technical Levels
- Support Levels: $25.07935 and $18.88453.
- Resistance Levels: $32.72271 and $38.91753.
Disclaimer
This article is for informational purposes only and provides no financial, investment, or other advice. The author or any people mentioned in this article are not responsible for any financial loss that may occur from investing in or trading. Please do your own research before making any financial decisions

With a background in journalism, Ritika Sharma has worked with many reputed media firms focusing on general news such as politics and crime. She joined The Coin Republic as a reporter for crypto, and found a great passion for cryptocurrency, Web3, NFTs and other digital assets. She spends a lot of time researching and delving deeper into these concepts around the clock, and is a strong advocate for women in STEM.


