
 Home
Home News
News

- 1 Fantom’s price took resistance and decreased by 6.40% over the last week.
- 2 The price of the Fantom is trading at $0.18927000 and the 52-week range is $0.16466000 – $0.65484000.
FTM is a DAG-based smart contract platform that offers DeFi services to developers with its own consensus algorithm. It claims to have fast and cheap transactions, under two seconds and fractions of a cent. It launched its mainnet, OPERA, in 2019, which is compatible with Ethereum and supports Solidity.

Fantom (FTM) is a fast and cheap smart contract platform for DeFi developers. Google Bard picked it for its ability to connect with other networks, like Ethereum. This makes it scalable and attractive for dApps. It uses Lachesis, an aBFT PoS consensus engine that secures the network and provides near-instant finality. It also has on-chain governance, where FTM token holders can vote with their tokens. FTM is the native token that is used for payments, fees, staking, and governance

Fantom fell by 2.14% in market value and by 11.51% in trading volume in the last 24 hours, as per CoinMarketCap, a crypto data and information website. Its market value is $530,321,289 and its trading volume is $36,091,223. There are 2,803,634,836 FTM in circulation.
Technical Analysis Of FTM on 1-D Time Frame
Fantom price showed a downward trend for the past three months, decreasing by 25.58% during this period and making lower lows and highs.
At the time of publication, the Fantom price is trading at $0.18893000 facing resistance and following a downward trendline and declining.
Therefore, if the Fantom price sustains the current level and rises, then it might hit the nearest resistance levels of $0.21671461 and $0.24623818.
However, the Fantom price could continue to move downwards and reach the nearest support at $0.17857999 and $0.16258806 if FTM fails to sustain the current level.
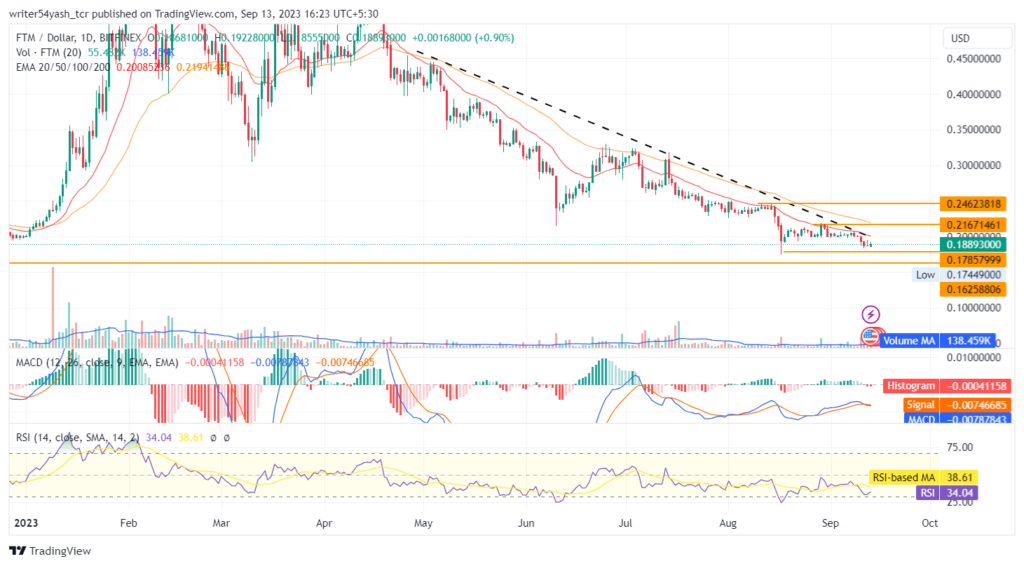
At the time of publishing, the Fantom (FTM) price is trading below the 20 and 50-day EMAs (exponential moving averages), which are rejecting the Fantom price trend.
The MACD line at 0.00787843 and the signal line at 0.00746685 are below the zero line and both lines cross each other but the gap is lean in the MACD oscillator. The current value of the RSI is 34.04 points and the 14-day SMA is below the median line at 38.61 points. Collectively, the indicators view is consolidation to bearish.
Conclusion
The Fantom price prediction shows a neutral to bearish outlook from investors and traders in the daily time frame. FTM price action reveals a neutral to downward trend at the time of writing. Moreover, the daily chart shows that the price might either consolidate or keep going down, according to indicators like RSI, EMA, and MACD.
Technical Levels:
- Support levels: $0.17857999 and $0.16258806
- Resistance levels: $0.21671461 and $0.24623818
Disclaimer
In this article, the views and opinions stated by the author, or any people named are for informational purposes only, and they don’t establish the investment, financial, or any other advice. Trading or investing in cryptocurrency assets comes with a risk of financial loss.

Andrew is a blockchain developer who developed his interest in cryptocurrencies while pursuing his post-graduation major in blockchain development. He is a keen observer of details and shares his passion for writing, along with coding. His backend knowledge about blockchain helps him give a unique perspective to his writing skills, and a reliable craft at explaining the concepts such as blockchain programming, languages and token minting. He also frequently shares technical details and performance indicators of ICOs and IDOs.


