
 Home
Home News
News
- 1 Synthetix price prediction showcases the downtrend momentum of SNX crypto.
- 2 Synthetix price dropped below the key moving average of 50 and 200-day EMA.
The Synthetix price analysis illustrates that the prices are losing the bearish momentum. The bulls made an attempt to snatch the game by adding more buying volume near the demand zone. The price surged but lost momentum near the 200-day EMA.

The daily chart shows that the price lost all the gains after it turned around after suffering rejection from the 200-day EMA. The price also seems to respect the upper boundary of the channel pattern and fell afterward.

The technical indicators 50 and 200-day EMA are showing a bearish crossover indicating weakness over the charts and the indicators might act as a dynamic resistance to the price. The buyers need to surpass the EMAs in order to shift the trend.
Analytics data as per CoinMarketCap shows that the whales hold a total of 69.9% of the supply with a significant decrement of 1% over the past year. Synthetix crypto currently trades at $2.08 with a decrement of 2.86% in the past day. SNX crypto holds a market cap of $561.8 Million and ranks 58th in the crypto market.
Synthetix Price Prediction Over the Daily Timeframe
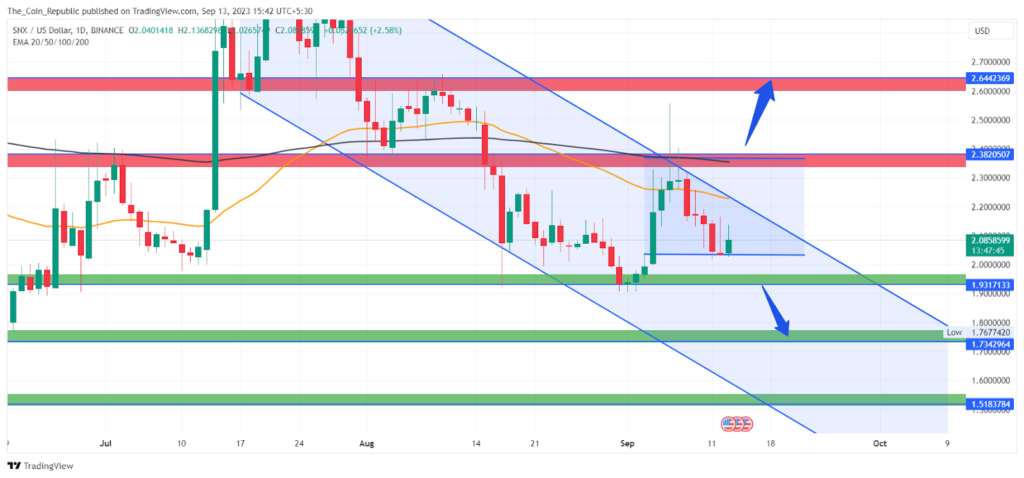
The SNX crypto price prediction illustrates that the price trend might remain indecisive and bearish until it is maintained in the channel. The price may keep rolling between the upper and lower boundary of the channel.
The sellers might remain dominant until the price trades below the key moving averages. The price trend favors the bears and they might try to keep dominating the game.
The bulls are losing as the price has wiped out the gains. The price needs a strong buying volume to accumulate near the demand zone to counter the bearish trend and make a breakout of the channel to shift the trend.
SNX Price Forecast from Indicators’ Point of View
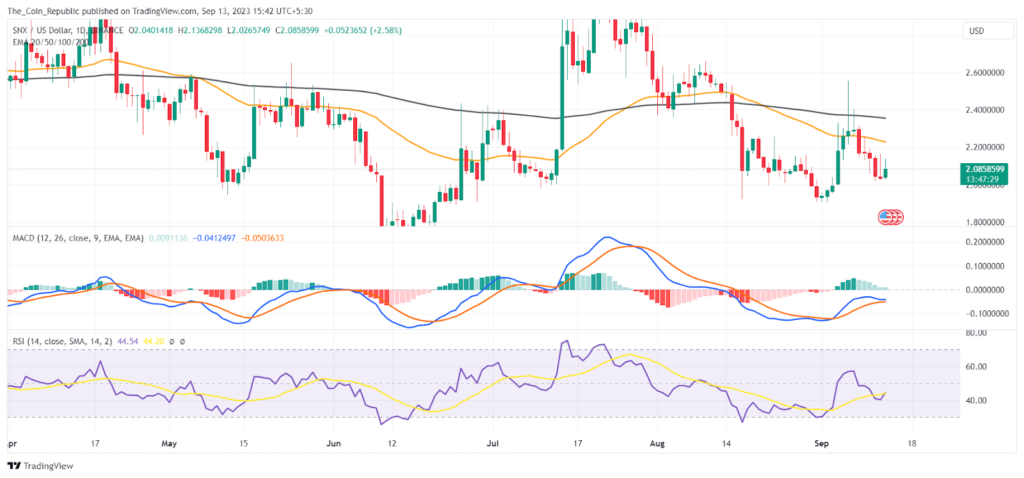
As per the EMA analysis, the SNX price is trading below the 50 and 200-day EMA; indicating bearishness over the charts. The price suffered multiple rejections from the key moving average of 50-day EMA and declined. The EMAs are acting as a dynamic resistance for the price.
MACD lines have made a bullish crossover. Histogram bars are also being formed above the mean line with decreasing height indicating a short bullish momentum fading as the bears might take over.
Conclusion
Synthetix price (SNX) analysis shows that the bulls are weak and the price is in a bearish channel. The price failed to break above the 200-day EMA and reversed from the upper boundary of the channel. The technical indicators are also bearish and may act as resistance. The whales hold 69.9% of the supply but have decreased by 1% in a year. Synthetix crypto trades at $2.08, down by 2.86% in a day. The price may remain bearish until it breaks out of the channel with strong buying volume.
Technical Levels
- Support levels: $1.93 and $1.73
- Resistance levels: $2.38 and $2.64
Disclaimer
The views and opinions stated by the author, or any people named in this article, are for informational purposes only and do not establish financial, investment, or other advice. Investing in or trading crypto or stock comes with a risk of financial loss.

Nancy J. Allen is a crypto enthusiast, with a major in macroeconomics and minor in business statistics. She believes that cryptocurrencies inspire people to be their own banks, and step aside from traditional monetary exchange systems. She is also intrigued by blockchain technology and its functioning. She frequently researches, and posts content on the top altcoins, their theoretical working principles and technical price predictions.


