
 Home
Home News
News
- 1 GM stock price at press time was $33.66 with a 0.57% rise in the last 24 hours with a current market cap of $46.313 Million.
- 2 GM stock price is in the range of $30.00 and $40.00.
GM stock price has been in a downtrend for the past three months, as it faced resistance from the higher levels and formed lower lows. This shows that the bears have been in control and the stock has lost its momentum. The stock has also broken below the key moving averages indicating weakness.
The stock has created a bearish momentum. GM stock has returned to its support level. Technical analysis suggests that the stock is oversold and could bounce back from the lower levels.

GM share price is in a correction phase but trading near the crucial support of $32.00. If formed, a bearish candle would indicate sellers are active and will try their best to drop the price. General Motors stock price closed the previous session at $33.66 with an intraday rise of 0.57%. If the buyers succeed in defending the $31 support, then the probability of a bounce-back will increase. However, if the sell-off continues and GM stock drops below $31, then, 10% to 15% drop is possible.
Buyers tried multiple times to break through the higher range and expand. However, due to the strong presence of sellers, prices faced rejection. It shows sellers are still active on higher levels.
Will GM Stock Sustain Above $31 Level?
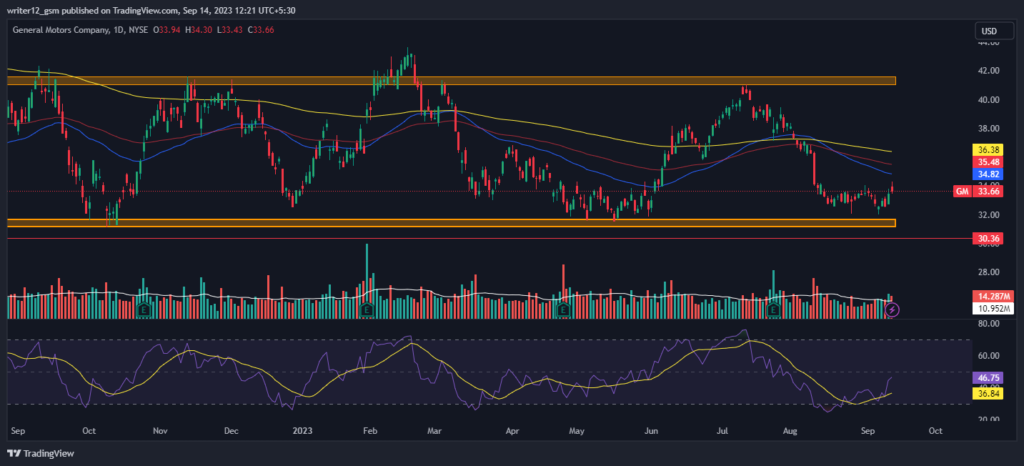
GM stock price is trading below the downward-sloping 50-day and 200-day EMA showcasing a downtrend. However, the GM price has gone far away from the EMAs.
The MACD generated a negative crossover and the histogram is also red, indicating bearishness. The RSI denotes weakness but is near the median territory.
The current value of RSI is 46.75 points. The 14 SMA is above the median line at 36.84 points indicating that GM stock is bearish.
Weekly-Time Horizon Analysis
GM stock has shown sellers’ strength on the weekly charts. Moreover, the price traded below the key EMAs, showing further weakness in the stock. The RSI curve is near the oversold region at 43. A negative outlook was noted, indicating bearishness in the stock. The MACD shows red bars, and a bearish crossover was noted, which signals corrective moves.
Summary
GM stock technical oscillators also support the bearish trend. The MACD, RSI, and EMA are emphasizing negative signs and imply that the downtrend may continue in the General Motors stock price. GM price action suggests that the investors and traders are bearish on the 1-D time frame. The price action reflects a bearish perspective at the moment.
Technical Levels
- Support Levels: $30.92 and $28.33
- Resistance Levels: $34.64 and $37.23
Disclaimer
This article is for informational purposes only and provides no financial, investment, or other advice. The author or any people mentioned in this article are not responsible for any financial loss that may occur from investing in or trading. Please do your own research before making any financial decisions.

With a background in journalism, Ritika Sharma has worked with many reputed media firms focusing on general news such as politics and crime. She joined The Coin Republic as a reporter for crypto, and found a great passion for cryptocurrency, Web3, NFTs and other digital assets. She spends a lot of time researching and delving deeper into these concepts around the clock, and is a strong advocate for women in STEM.


