
 Home
Home News
News
- 1 QTUM price currently trades at $2.125 while witnessing a gain of 1.38% during the intraday trading session.
- 2 QTUM price has dropped below 20,50,100 and 200-day exponential moving averages.
- 3 The year-to-date return of QTUM is 15.68% while the monthly return is -16.93%.
Qtum price entered into a strong bullish trend after the formation of a support level at $2 during mid-June. The bullish rally commenced after the release of news regarding BlackRock, an investment management firm, filing for Bitcoin Spot ETF.
However, QTUM could not sustain the bullish rally for long and the price faced strong rejection above $3.50. On July 1, the cryptocurrency price formed a high at $3.567 and closed at $3 after facing rejection. Since then, there has been a significant downfall and the price corrected the bullish move.
Currently, the asset price has fallen to the same level from where the bullish rally was initiated i.e. $2 level. The asset price has formed strong support at $2 and is currently headed toward the next minor resistance level of $2.30.
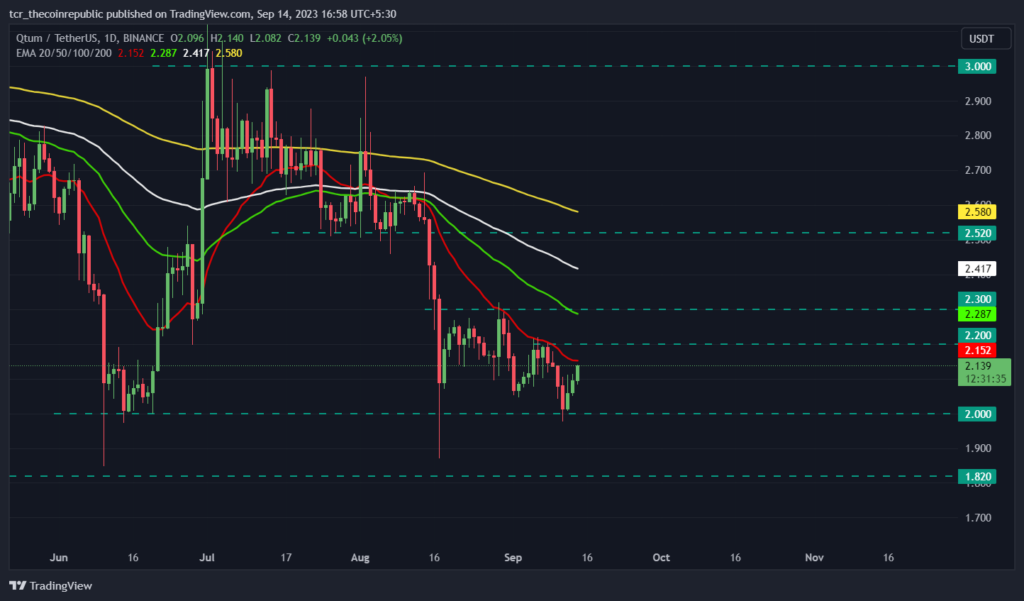
If the bullish momentum sustains and the asset price can break the resistance level of $2.30, it might rise toward the next support-turned-resistance level of $2.52. On the other hand, if bears take control and push the price below $2, the price might fill the lower wick of the 17th August candle and potentially fall toward $1.82.
The market capitalization of QTUM has increased by 1.83% to $223,126,544. The 24-hour trading volume is down 3.64% at the time of writing. QTUM price is down 98.01% from the all-time high of $106.88 and up 176.22% from the all-time low of $0.77.
QTUM Celebrated 6 Years of Mainnet
On September 13, QTUM celebrated 6 years of QTUM’s Mainnet. The vision of the launch was to combine Bitcoins’ stability and Ethereum’s smart contract. The journey continues with the v24.1 hard fork in late 2023 which focuses on enhancing developers’ experiences and ordinal support.
Will QTUM Price Retest $2.30?
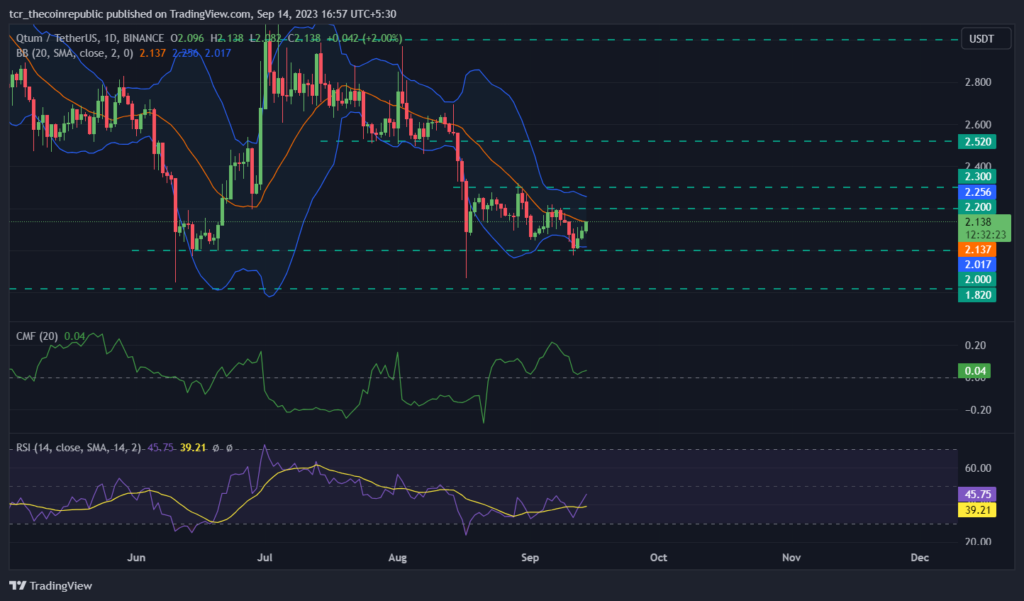
The cryptocurrency price has melted below 20,50,100 and 200-day exponential moving averages, suggesting bearish momentum. However, the price is slowly entering into recovery mode.
Chaikin money flow score has stayed above the 0 mark and currently trades at 0.04, implying slight strength and capital inflow in the market. The relative strength index (RSI) has surged to 45.44 indicating a rise in the participation of bulls in the market. The Bollinger bands have contracted which implies a decrease in volatility.
The long/short ratio of QTUM is 1.03 with 50.89% longs and 49.11% shorts, suggesting slightly higher pressure from the buying side in the last 24 hours.
Conclusion
QTUM’s price has been printing a bullish candle for the last 2 days after the formation of support at $2. Technical parameters also show that there is a rise in the participation of bulls in the market.
Technical Levels
Major support: $2 and $1.82
Major resistance: $2.30 and $2.52
Disclaimer
The views and opinions stated by the author, or any people named in this article, are for informational purposes only. They do not establish financial, investment, or other advice. Investing in or trading crypto assets comes with a risk of financial loss.

Andrew is a blockchain developer who developed his interest in cryptocurrencies while pursuing his post-graduation major in blockchain development. He is a keen observer of details and shares his passion for writing, along with coding. His backend knowledge about blockchain helps him give a unique perspective to his writing skills, and a reliable craft at explaining the concepts such as blockchain programming, languages and token minting. He also frequently shares technical details and performance indicators of ICOs and IDOs.


