
 Home
Home News
News

- 1 VeChain’s price took resistance and decreased by 12.66% over the last month.
- 2 The price of the VeChain is trading at $0.01624900 and the 52-week range is $0.0.01339000 – $0.03243900.
VeChain is a public blockchain platform that uses smart contracts and IoT to create a trustless data ecosystem for various industries. VeChain started as a private blockchain in 2015 but became public in 2018 with its own token VET.

VeChain uses two tokens, VET and VTHO, to run its network. VET generates VTHO and acts as a value transfer medium. VTHO pays for gas costs and can be adjusted to keep the network stable. VeChain has a distributed governance system that allows stakeholders to vote on changes. VeChain helps improve efficiency, traceability, and transparency across data trails, supply chains, and novel ecosystems.

VeChain rose by 0.40% in market value and fell by 49.95% in trading volume in the last 24 hours, as per CoinMarketCap which is a crypto information website. Its market value is $1,186,237,379 and its trading volume is $50,024,439. There are 72,714,516,834 VET in circulation.
The VeChain price has been on a downtrend for the last six months, losing 32.92% of its value. The price has been creating lower highs and lows, showing a lack of buyers.
The VeChain price is now at $0.0.01624900 and facing a downward trendline that has been a resistance since March 2023. The price is also under the 20 and 50-day EMAs, which have more resistance levels.
The VeChain price could bounce back if it breaks above the downward trendline and EMAs. The next resistance levels are $0.01692344 and $0.01862609, based on the previous highs and lows.
The VeChain price could drop further if it fails to break the current resistance and keeps falling. The next support levels are $0.01446406 and $0.01862609.
Technical Analysis of VET on 1-D TimeFrame
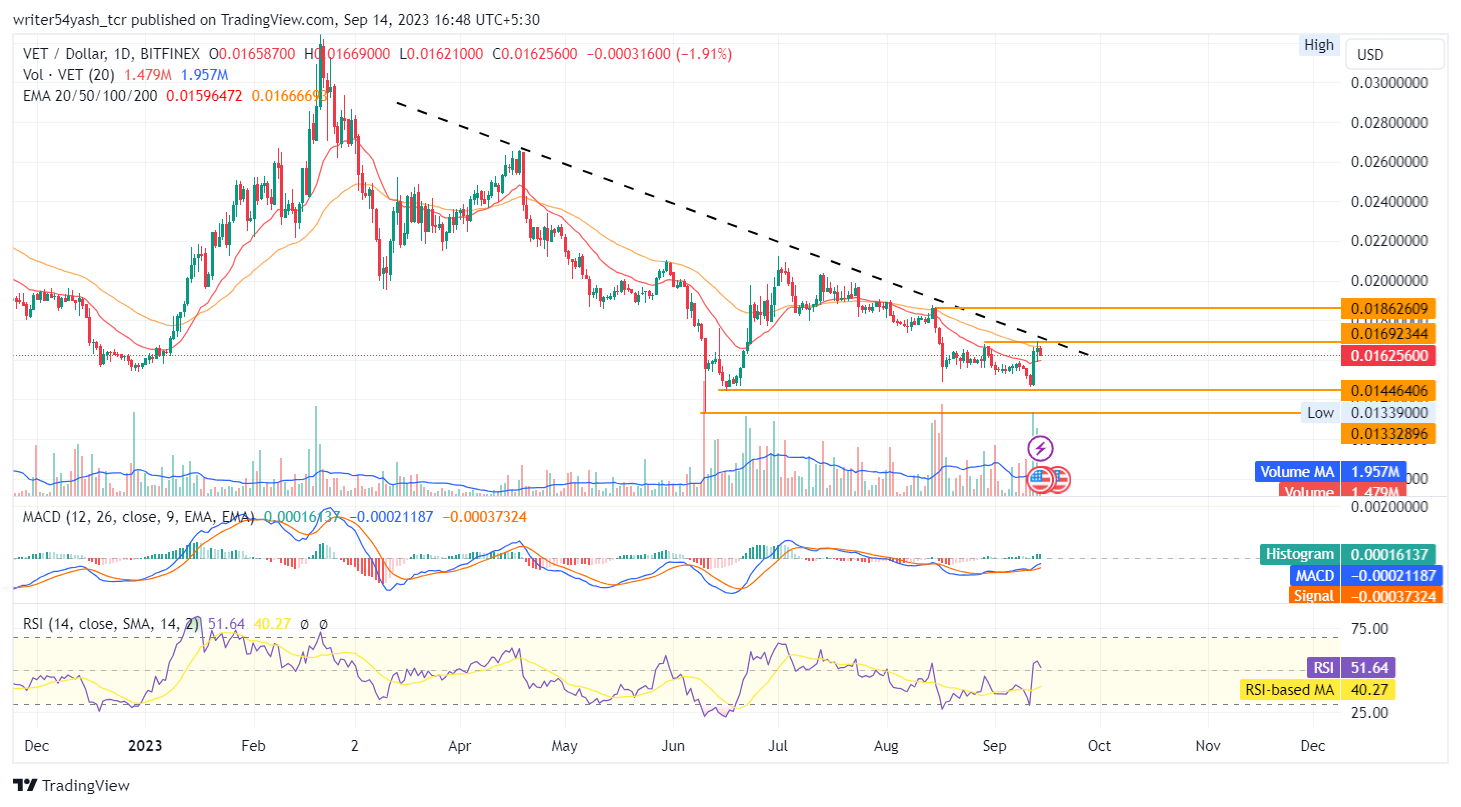
At the time of publishing, the VeChain price is trading below the 20, and 50-day EMAs (exponential moving averages), which are rejecting the VeChain price trend.
The MACD line at 0.000212 and the signal line at 0.000375 are below the zero line and both lines cross each other but the gap is lean in the MACD oscillator. The current value of the RSI is 51.56 points and the 14-day SMA is below the median line at 40.26 points. Collectively, the indicators view is consolidation to bearish.
Conclusion
The VeChain price prediction shows a neutral to bearish outlook from investors and traders in the daily time frame. VET price action reveals a neutral to downward trend at the time of writing. Moreover, the daily chart shows that the price might either consolidate or keep going down, according to technical tools such as RSI, EMA, and MACD.
Technical Levels:
- Support levels: $0.5344 and $0.6866
- Resistance levels: $0.4082 and $0.3154
Disclaimer
In this article, the views and opinions stated by the author, or any people named are for informational purposes only, and they don’t establish the investment, financial, or any other advice. Trading or investing in cryptocurrency assets comes with a risk of financial loss.

Adarsh Singh is a true connoisseur of Defi and Blockchain technologies, who left his job at a “Big 4” multinational finance firm to pursue crypto and NFT trading full-time. He has a strong background in finance, with MBA from a prestigious B-school. He delves deep into these innovative fields, unraveling their intricacies. Uncovering hidden gems, be it coins, tokens or NFTs, is his expertise. NFTs drive deep interest for him, and his creative analysis of NFTs opens up engaging narratives. He strives to bring decentralized digital assets accessible to the masses.


