
 Home
Home News
News

- 1 Zilliqa crypto price is currently trading at $0.01605454 with a rise of 2.00% in the last 24 hours with a current market cap of $254.483 Million (press time.
- 2 Zilliqa’s crypto price decreased by -2.72% over the past seven days.
- 3 ZILUSD is trading below key moving averages.
The price action of the Zilliqa crypto shows that selling pressure was noted on the charts and it is in a downtrend, forming lower lows over the past few months. Moreover, due to declining investor interest, trading volume was below average.

The decline in activity could also have fuelled the bearish outlook on the chart.

At the time of writing, the Zilliqa price is trading at $0.01605454 with an intraday gain of 2.00%, bouncing off the lower trendline near the support. Moreover, the intraday trading volume is $3.793 Million and the market cap is 254.483 Million.
Year-to-date, it gave nominal returns of 1.05%; it gave negative return -45.32% in the span of 6 months. In the last 1 month, it gave a negative return of 19.72% and -2.59% in the last seven days. Indicating a long Bearish trend continuing till now.
Technical Analysis of Zilliqa Crypto Price in 1-D Timeframe
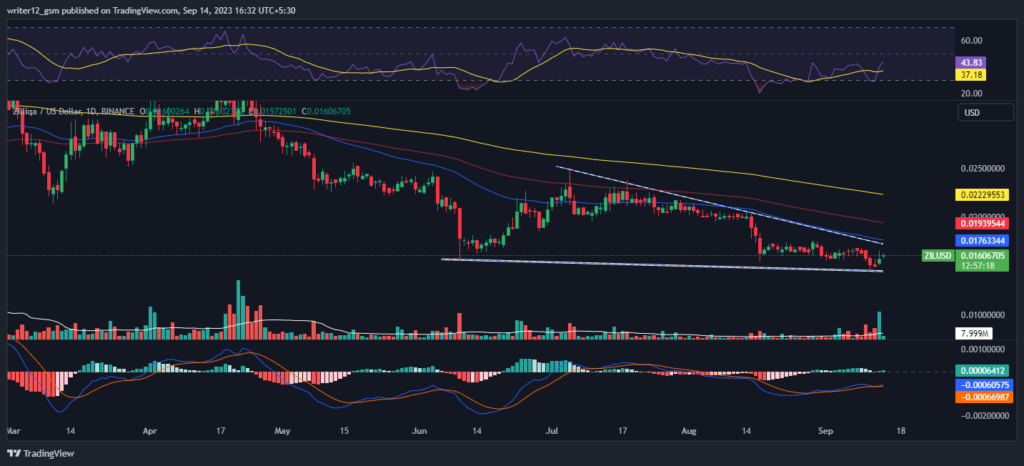
The ongoing trend favors bears, and the crypto was also in a corrective phase, which made buyers cautious. Moreover, Zilliqa is trading below the significant moving averages and could attain the 50-day EMA to hold the gains.
At the time of publishing, Zilliqa crypto (USD: ZIL) was trading above the 50 and 200-day SMAs (simple moving averages), which are not support the price trend.
The current value of RSI is 43.83 points. The 14 SMA is above the median line at 37.18 points which indicates that the Zilliqa crypto is bearish.
The MACD line at -0.00060575 and the signal line at -0.00066987 are above the zero line. A bearish crossover is observed in the MACD indicator which signals more bearishness for the ZIL crypto price.
4 Hour time frame Technical Evaluation
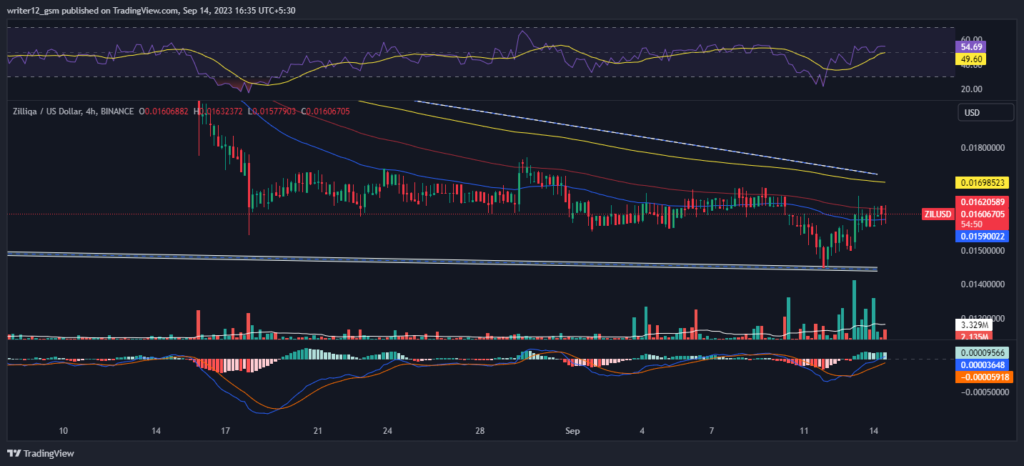
On the 4-hour charts, the Zilliqa price is stuck in a narrow range and does not signal an upcoming rise because of low volume levels. Moreover, a key indicator is still in the neutral range and does not signal bullishness.
The RSI curve is near 54, in the neutral range, and showed a narrow consolidation move on the short-term charts. The MACD indicator shows green bars on the histogram with a bullish crossover but did not signal any substantial upswing.
Summary
Zilliqa price action suggests that the investors and traders are bearish on the 1-D time frame. The price action reflects a bearish perspective at the moment. Zilliqa (USD: ZIL) technical oscillators also support the bearish trend. The MACD, RSI, and EMA are emphasizing negative signs and imply that the downtrend may continue in the ZIL crypto price.
Technical Levels
- Support Levels: $0.01388406 and $0.01168413.
- Resistance Levels: $0.01763376 and $0.01983369.
Disclaimer
This article is for informational purposes only and provides no financial, investment, or other advice. The author or any people mentioned in this article are not responsible for any financial loss that may occur from investing in or trading. Please do your own research before making any financial decisions

Adarsh Singh is a true connoisseur of Defi and Blockchain technologies, who left his job at a “Big 4” multinational finance firm to pursue crypto and NFT trading full-time. He has a strong background in finance, with MBA from a prestigious B-school. He delves deep into these innovative fields, unraveling their intricacies. Uncovering hidden gems, be it coins, tokens or NFTs, is his expertise. NFTs drive deep interest for him, and his creative analysis of NFTs opens up engaging narratives. He strives to bring decentralized digital assets accessible to the masses.


