
 Home
Home News
News
- 1 Decentraland price (MANA) surged 2.8% in the last 24 hours and is currently trading at $0.28.
- 2 Decentraland price is declining forming a parallel channel pattern over the daily timeframe.
The MANA price has been continuously declining, losing most of the gains and forming new all-time lows. The price is in a continuous decline trend suffering multiple rejections from the key exponential moving average of 50-day EMA.
The daily chart illustrates a strong bearish trend prevailing in crypto as the price slipped below the previous swing low and consolidated. The price trend favors the bears and shows a lack of buyers at the lower levels.
The price prediction over the daily chart shows that the price is showing a consolidation after the breakdown of the previous swing low. The breakdown of the consolidation may again show a decline to the lower levels.
The year 2023 has not been a profitable year for MANA investors as the crypto has experienced strong selling after a short-term hike in January. Since then, the price has lost more than 50% of its market capitalization and still declined to erode more.
Decentraland Price Prediction Using Price Action Strategy
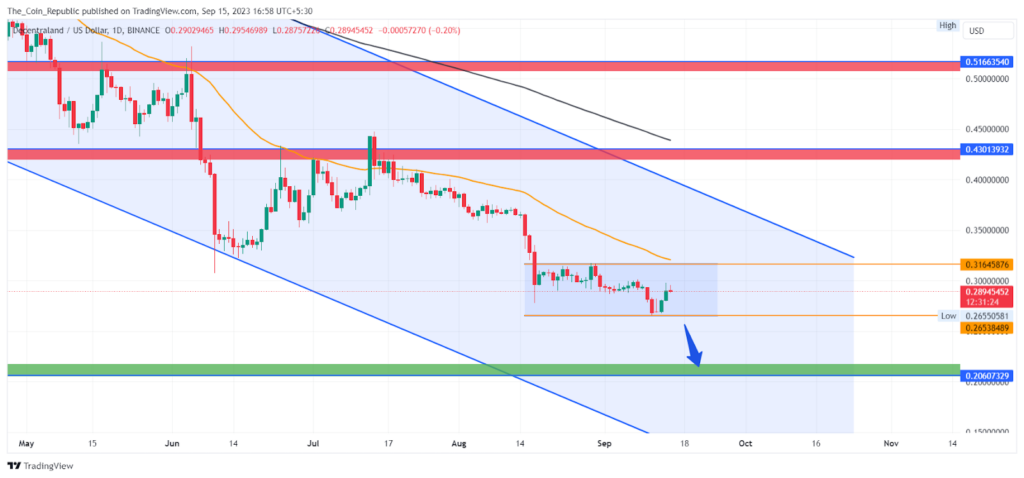
The analysts observe that the MANA price trend may remain under the control of bears until it remains in the channel. The MANA price is consolidating at a swing low and showing no signs of recovery.
The price may decline more as there is no major resistance to the lower side and the trend is totally in the control of bears.
The volume analysis also shows that the volume received is less than the average volume indicating bearishness in the market. The MANA token has received a $55.28 Million volume in the past 24 hours which is nearly 46% more than the past day.
MANA Price Forecast From Indicators’ Point of View
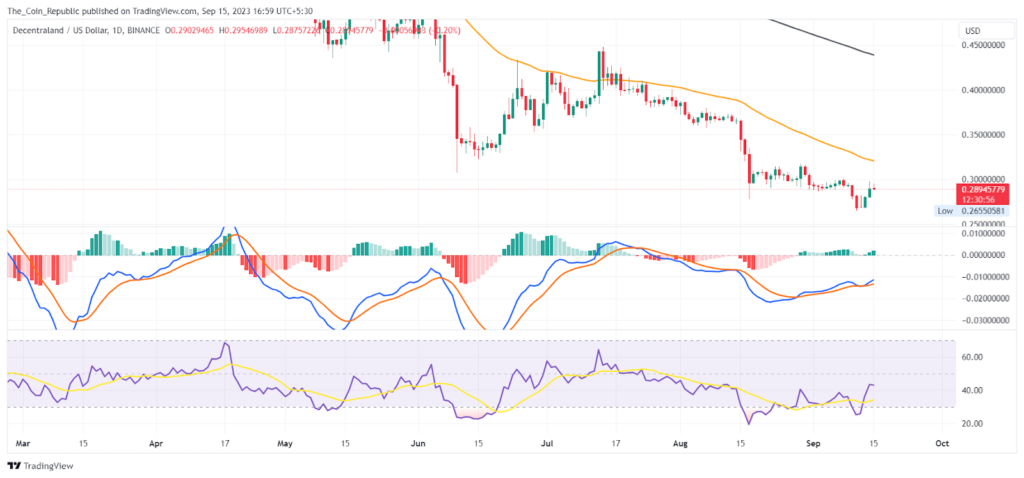
As per the EMA analysis, the MANA price is trading below the 50 and 200-day EMA indicating weakness over the charts. The price suffered multiple rejections from the 50 EMA and declined.
MACD lines have shown a bearish crossover. The histogram bars are also being formed below the mean line with negligible height indicating the bears losing momentum which might be a bullish sign for the investors.
Conclusion
Decentraland (MANA) price is in a steep downtrend and has broken below the previous low. The price is consolidating at a low level and may fall further if it breaks the consolidation. The price is below the 50-day EMA and faces bearish pressure. The volume is low and shows a lack of buyers. MANA is the second-largest crypto by market cap but it is losing momentum. The price may crash further if it does not find enough buyers to support it.
Technical Levels
- Support levels: $0.25 and $0.20
- Resistance levels: $0.31 and $0.43
Disclaimer
The views and opinions stated by the author, or any people named in this article, are for informational purposes only and do not establish financial, investment, or other advice. Investing in or trading crypto or stock comes with a risk of financial loss.
Steve Anderson is an Australian crypto enthusiast. He is a specialist in management and trading for over 5 years. Steve has worked as a crypto trader, he loves learning about decentralisation, understanding the true potential of the blockchain.


