
 Home
Home News
News

- 1 Ford stock price is rising from the lower support levels.
- 2 F stock price getting support from the bulls, this week it gained 5.61%, and 4.64% last month.
- 3 FORD stock price is about to break the key moving averages.
FORD stock price has taken a reversal from a lower level of $11.63 and is heading towards the key EMAs. Ford stock price was up by 4.64% last month.
F stock is showing signs of strength as it heads toward the 200-day EMA, a key indicator for long-term trends. It closed at $12.62, down by 0.16% for the day. The trading volume was 43.462 Million, compared to the 10-day average of 42.915 Million. The market capitalization of FORD stock is $50.508 Billion.

FORD stock price has seen a slight increase of about 5.61% over the past week and a modest gain of 4.64% over the past month. However, the stock has not performed well over the longer term, as it fell by about 13.09% over the past three months, and by about 14.50% over the past year. The stock’s performance throughout the year has also been disappointing as it is trading in a tight range.
FORD Stock Price Ready to Breach $15 Level
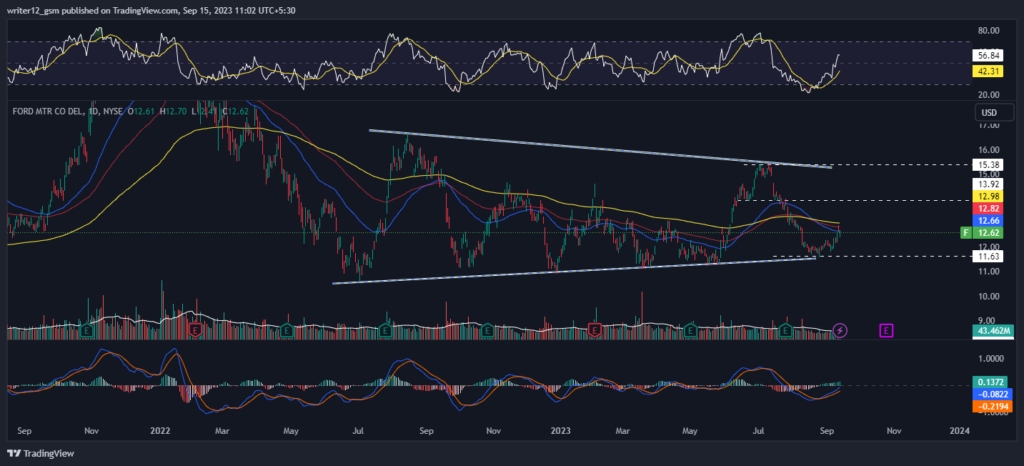
FORD stock price is currently trading below the 50, 100, and 200-day moving averages. However, buyers are trying to breach the essential EMA levels to attain higher levels.
The bullish crossover and the green bars indicating bullishness on the MACD chart. MACD line is at -0.0822 and the signal line is at -0.2194 heading upward.
RSI is trading at 56.84 points and 14 SMA is below it at 42.31 heading upwards towards the overbought zone indicating a bullish trend.
How is F Stock Performing on the Weekly Timeframe?
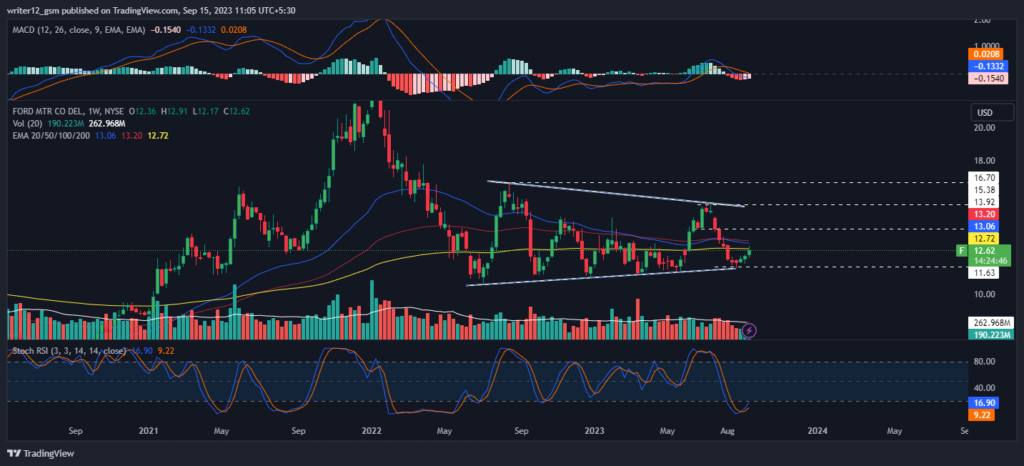
On the weekly chart, the stock price is heading upwards, taking support from the lower levels and forming three green candles indicating positive momentum. However, the MACD and RSI are trading in the neutral zone, indicating neutrality. Moreover, the exact direction of the trend will be decided in the next few sessions.
Summary
FORD stock price is trading in a narrow channel heading upward from the lower levels. The main hurdle in the path of the upward rally is a cluster of EMAs acting as resistance. If the F stock price breaches the key EMAs level, then it could reach the $15 level in the upcoming days.
Technical Levels
- Support Levels: $11.33 and $10.52
- Resistance Levels: $13.19 and $14.24
Disclaimer
This article is for informational purposes only and provides no financial, investment, or other advice. The author or any people mentioned in this article are not responsible for any financial loss that may occur from investing in or trading. Please do your own research before making any financial decisions.
Steve Anderson is an Australian crypto enthusiast. He is a specialist in management and trading for over 5 years. Steve has worked as a crypto trader, he loves learning about decentralisation, understanding the true potential of the blockchain.


