
 Home
Home News
News

- 1 TRX price is surging within a rising parallel channel.
- 2 Buyers continue to accumulate the crypto.
Tron (TRX) price is riding within the rising parallel channel. The TRX price is trading above the significant moving averages and bulls are looking to shift the rally toward the upper trendline of the channel near $0.08800 suggesting follow on buying action might show in the coming sessions. TRX has shown a bullish crossover, surpassing the primary hurdle of $0.08000.

TRX price is trading above the cluster of $0.08200 and investors are showing their interest by accumulating it. The bears look trapped and persist in covering their positions, resulting in a bull move above the 20 day EMA. TRON price needs to escape the ongoing hurdle of $0.08800 to extend the rally toward the supply zone of $0.09000 for the coming sessions.

At press time, TRX price is trading at $0.08399 with an intraday gain of 0.26%, showing bullishness on the charts. Moreover, the trading volume increased by 2.91% to $266.80 Million and the pair of TRX/BTC is at 0.0000317 BTC. However the market cap of TRX is $7.54 Billion. Moreover, analysts maintained a buy rating and suggested a strong growth outlook.
TRX Delivers Bullishness on Daily Charts
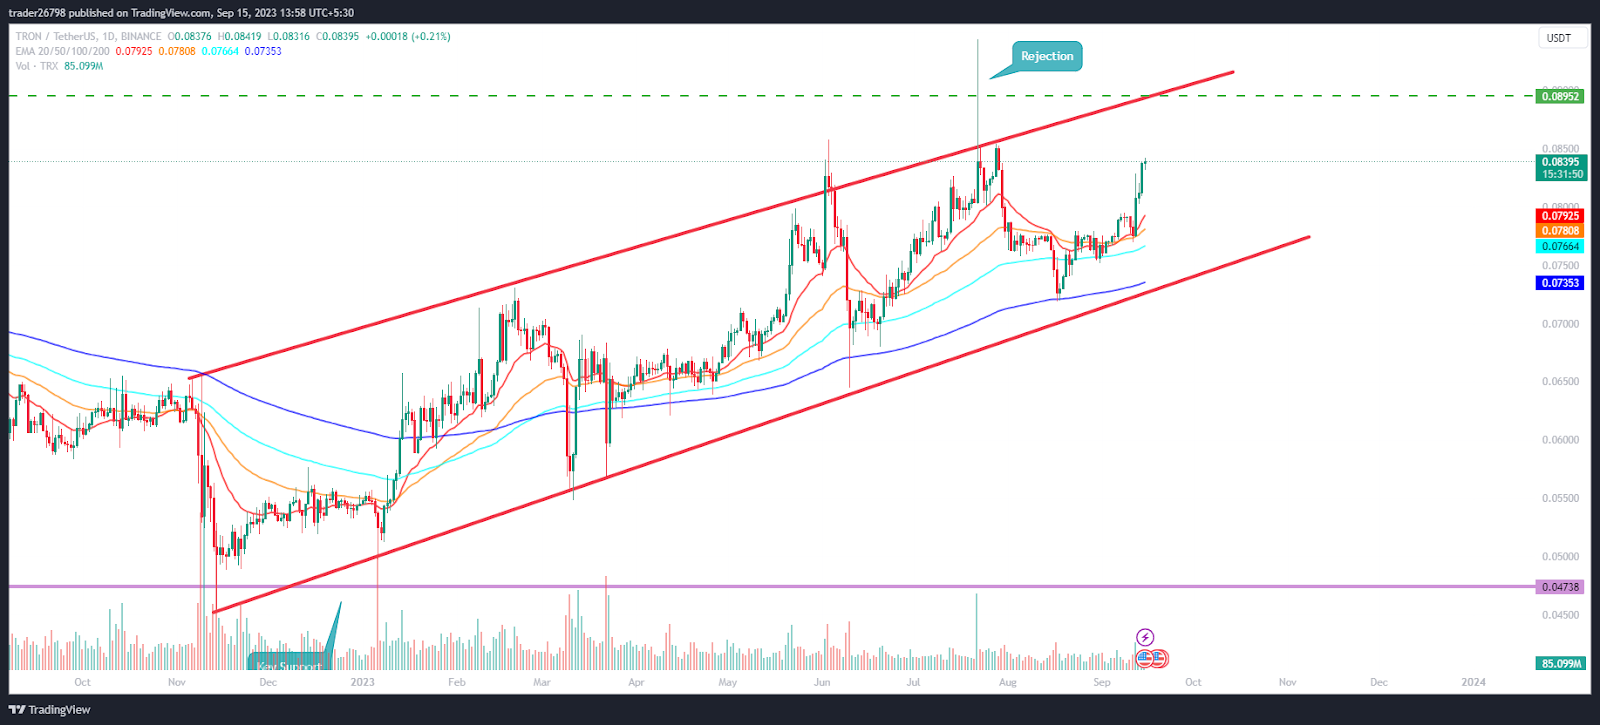
On the daily charts, TRX price is trading inside the rising parallel channel and continues to extend the gains amid the weak crypto market. TRX persists in registering a breakout, surpassing clusters decisively, and is trading above the key moving averages showing strong buyer interest. Moreover, the TRX price is near the 61.8% Fib zone and is close to the upper bollinger band suggesting a near-term breakout can be anticipated.
TRX Indicates Range Breakout on Short Term Chart
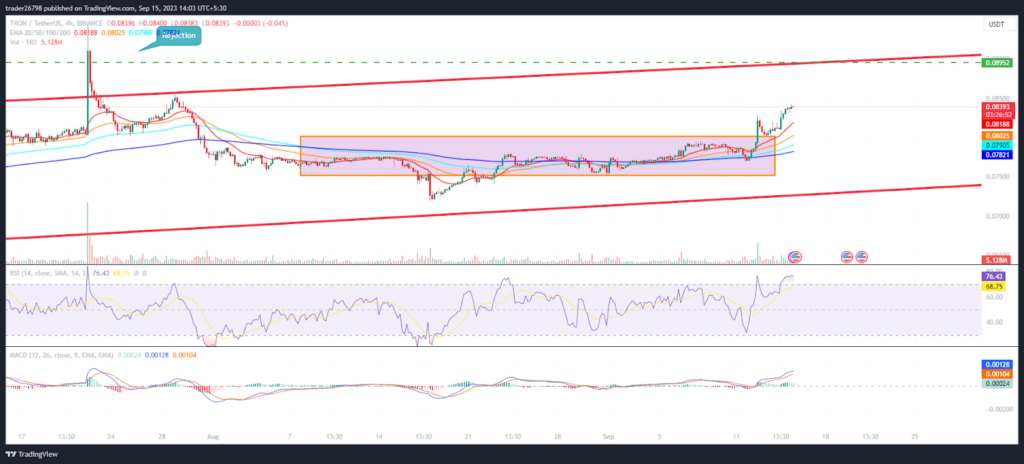
On the 4 hour charts, TRX shows a range breakout and is looking to reach the channel highs near $0.08800 in the next sessions. Moreover, the chart structure suggests that follow on buying will continue and TRX will skyrocket.
The RSI curve sharply rose toward the overbought zone and is near 75 indicating a strong bull momentum on the charts
The MACD indicator showed a bullish crossover, forming green bars on the histogram which suggests a positive outlook.
Summary
TRON (TRX) price is trading in the bull trajectory and persists in gaining inside the rising parallel channel. Moreover, the price action suggests that TRX will extend the follow-on buying momentum and may retest the higher end of the channel near $0.08800 and may register a breakout soon.
Technical Levels
Support Levels: $0.08200 and $0.08000
Resistance Levels: $0.08800 and $0.09000
Disclaimer
The views and opinions stated by the author or any other person named in this article are for informational purposes only and do not constitute financial, investment, or other advice. Investing in or trading crypto or stocks comes with a risk of financial loss.
Steve Anderson is an Australian crypto enthusiast. He is a specialist in management and trading for over 5 years. Steve has worked as a crypto trader, he loves learning about decentralisation, understanding the true potential of the blockchain.


