
 Home
Home News
News
- 1 ChargePoint Holdings, Inc. stock lost more than 11% of its trading price positive negative earning release.
- 2 CHPT stock is expected to fall below $5 and is expected to register a fresh 52 weeks low.
CHPT stock has significantly lost 7.11% of its trading price on September 15 trading session. As per trading volume, sellers dominated buyers which led to a severe decline in past trading sessions.
CHPT Stock Technical Analysis
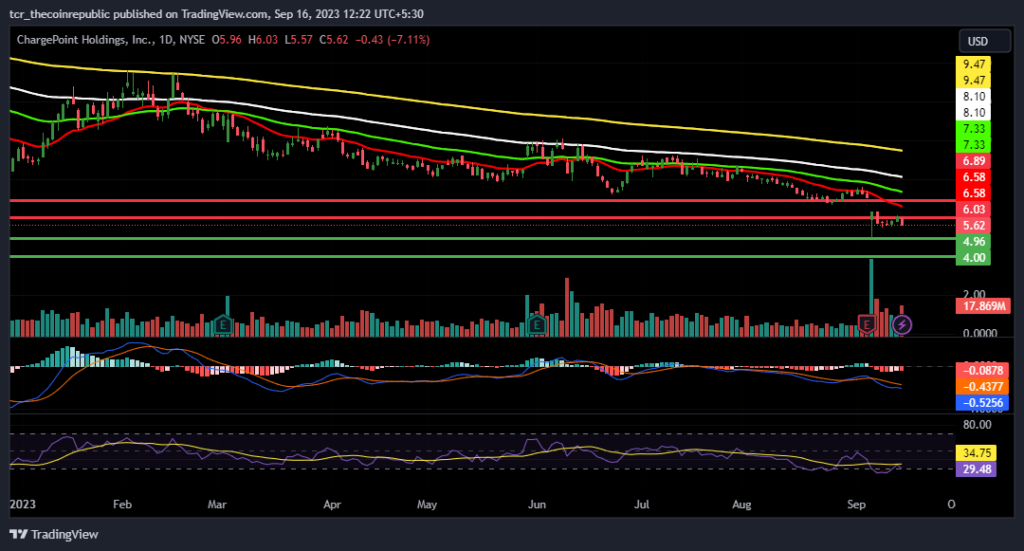
In the 52 weeks time frame, CHPT stock price peaked at $18.25, and its lowest traded price was $4.96. Over the past one week, CHPT was on a steady decline, losing 11.22%.

It is important to note that CHPT stock lost 41.82% of its trading price in the YTD time frame and a drop of 69.36% is seen in the 52 weeks time frame. At the time of publication, CHPT stop was trading below its annual price target of $10.88.
ChargePoint Holdings, Inc. has a market capitalization of $2.024 Billion. A decline of 37.86% is seen in the market capitalization in 2023 compared to that in 2022. The average trading volume of CHPT shares is 16.352 Million.
The MACD line and signal line are moving parallely, reflecting extreme negativity. The histogram shows significant seller presence. If sellers continue their dominance, further downside is possible.
The RSI line is tumbling near the RSI lower band and there are chances that continued sellers’ dominance might guide RSI towards oversold territory. On September 15, CHPT stock’s lowest traded price was $5.57 and its highest trading price was $6.03.
Market analysts believe that if selling pressure continues, CHPT stock price might slip further below $5 and might register a fresh 52 week low. The nearest support visible is $4.96, probably next support of $4.
If buyers succeed in dominating sellers, CHPT stock might face resistance at $6.03 followed by $6.89. At press time, ChargePoint Holdings, Inc. stock was trading below 20,50,100 and 200 day EMAs.
ChargePoint Holdings, Inc. Financial Updates
ChargePoint Holdings, Inc. failed to meet analysts’ expectations as its reported revenue was 1.80% lesser than estimated figures. Estimated EPS was negative $0.13, but the reported EPS was negative $0.35, which resulted in a 161.62% decline in the EPS. The expected EPS for the third quarter is negative $0.21 and expected revenue for the next quarter is $159.29 Million.
From the reported revenue of Q2 2023, operating income of the company was negative $123.33 Million, Pretax income was negative $124.35 Million and net income of the company was negative $125.25 Million. Even after this negativity ChargePoint Holdings, Inc. generated $1.13 Million in gross profit.
Technical Levels
Support Level: $4.96 & $4.00
Resistance Level: $6.03 & $6.89
Conclusion:
CHPT stock is struggling below 20 day EMA and sellers dominance barred the possible surge. As per market analysts, more downside is possible signs of recovery are null in the short term. In other contexts, CHPT stock might only recover once the control comes in the hands of buyers.
Disclaimer
The views and opinions stated by the author, or any people named in this article, are for informational ideas only and do not establish financial, investment, or other advice. Investing in or trading crypto or stock comes with a risk of financial loss.

Andrew is a blockchain developer who developed his interest in cryptocurrencies while pursuing his post-graduation major in blockchain development. He is a keen observer of details and shares his passion for writing, along with coding. His backend knowledge about blockchain helps him give a unique perspective to his writing skills, and a reliable craft at explaining the concepts such as blockchain programming, languages and token minting. He also frequently shares technical details and performance indicators of ICOs and IDOs.


