
 Home
Home News
News

- 1 The LVS stock chart shows a breakdown and is looking weaker on the charts.
- 2 Buyers are facing strong selling pressure; failed to hold the 200-day EMA.
Las Vegas Sands Corp. (NYSE: LVS) stock price shows a descending triangle pattern breakdown and slipped below the 200-day EMA, indicating massive bear strength. Moreover, the price action signifies short buildups. The bulls are in trouble; faced a selloff in the past few sessions. However, the LVS stock price is close to the round mark of $50, and bulls will try to hold the region, but they have a comeback challenge.
LVS stock price is trading below the significant moving averages reversing from the top, indicating a correction in the past few trading sessions. Moreover, the chart structure indicates sellers have picked up momentum and succeeded in smashing the primary support zone of $50. Furthermore, LVS stock price has shown a rejection while retesting the 200-day EMA, suggesting that the bulls did not have enough strength to hold the gains.

At press time, LVS stock price is trading at $48.74 with an intraday drop of 0.39%, showing a neutral chart structure. Moreover, the trading volume increased by 0.87% to 5.163 Million. The market cap is $37.259 Billion. However, analysts maintained a buy rating with a yearly target price of $69.62, suggesting a significant upside for the upcoming sessions.
Las Vegas Sands Corp. engages in the development of destination properties. The firm operates through the Macau and Singapore geographical segments. The Macao segment handles the operations of The Venetian Macao, The Londoner Macao, The Parisian Macao, The Plaza Macao, Four Seasons Macau, and Sands Macao. The Singapore segment includes the Marina Bay Sands. The company was founded by Sheldon G. Adelson in August 2004 and is headquartered in Las Vegas, NV.
LVS Stock Shows Breakdown on Daily Chart
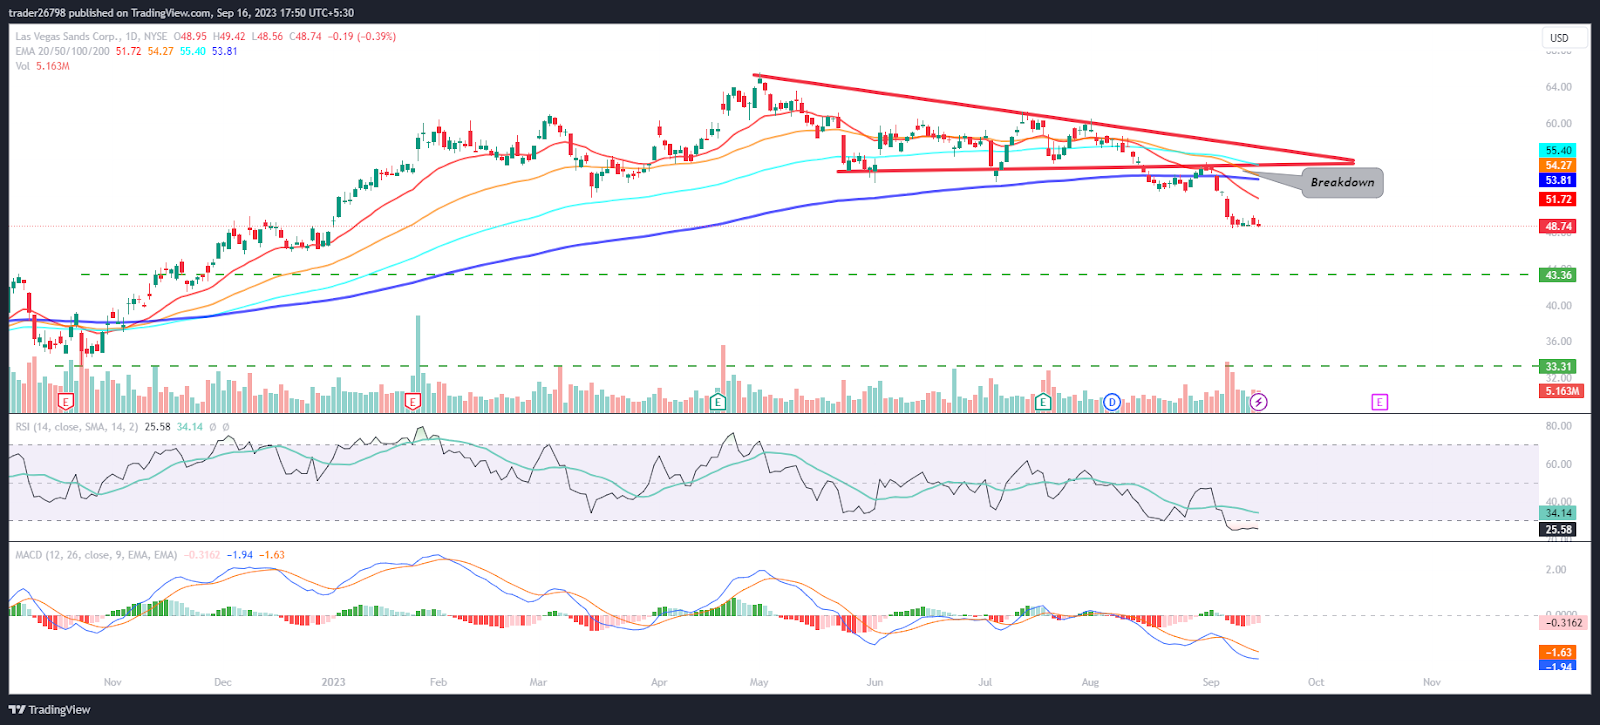
On the daily charts, LVS stock price has slipped below the 200-day EMA and is hovering below the round mark of $50, indicating selling pressure in the past sessions. Moreover, the chart structure shows that the price is consolidating after the breakdown and waiting for a decisive move. If the price holds the gains and attains a pullback, it will retest the 200-day EMA soon, whereas if it breaks below $45, it will reach $35 in the following sessions.
The RSI curve stayed in the oversold region and showed a bearish divergence, indicating a negative outlook on the charts.
The MACD indicator showed a bearish crossover and formed red bars on the histogram, suggesting a volatile chart structure. Further selloff is expected in the following sessions.
Summary
LVS stock price is trading below the significant moving averages, suggesting a negative outlook for the following sessions. Moreover, the price action indicates short buildup, and LVS share face headwinds and show seller dominance for the past sessions. However, the bulls have tried to hold the gains and are looking for a rebound to retest the 200-day EMA.
Technical Levels
Support Levels: $45 and $35
Resistance Levels: $55 and $65
Disclaimer
The views and opinions stated by the author or any other person named in this article are for informational purposes only and do not constitute financial, investment, or other advice. Investing in or trading crypto or stocks comes with a risk of financial loss.

Adarsh Singh is a true connoisseur of Defi and Blockchain technologies, who left his job at a “Big 4” multinational finance firm to pursue crypto and NFT trading full-time. He has a strong background in finance, with MBA from a prestigious B-school. He delves deep into these innovative fields, unraveling their intricacies. Uncovering hidden gems, be it coins, tokens or NFTs, is his expertise. NFTs drive deep interest for him, and his creative analysis of NFTs opens up engaging narratives. He strives to bring decentralized digital assets accessible to the masses.


