
 Home
Home News
News

- 1 Stellar crypto price decreased by 5.78% over the past seven days.
- 2 Stellar crypto price is currently trading at $0.119465 with a drop of 0.70% in the last 24 hours and a current market cap of $3.291 Million.
Stellar crypto continues to exhibit weakness on the charts, with sellers exerting significant pressure. Furthermore, the chart structure favors the bears, and the price continues to form bearish candles, which shows a fight between bears and bulls.

At the time of writing, the Stellar crypto trades at $0.119465 with an intraday drop of 0.70%, indicating bearishness. Buyers are making efforts to gain traction in the market, but they were only able to secure a few critical levels of support. Intraday trading volume is 18.352 million. Moreover, the XLM crypto suggests further volatility in the following sessions.

Stellar crypto is trading in a downtrend on the daily charts and has underperformed in the past few months. Furthermore, the technical indicators continue to signal bearishness, with no signs of a bullish reversal or a bounce.
Technical Analysis of Stellar Crypto Price in 1-D Timeframe
On the 4-hour charts, the XLM crypto is under the control of the sellers, and buyers are not able to surpass the range of neutrality. The price action indicates that sellers are persistently pushing back against the bulls below the lower trajectory, causing the gains from the top to erode.
The relative strength index (RSI) curve is near the neutral range of 42, indicating negative divergence and bearishness. The MACD also gave a neutral signal suggesting that a significant move is likely in the upcoming sessions.
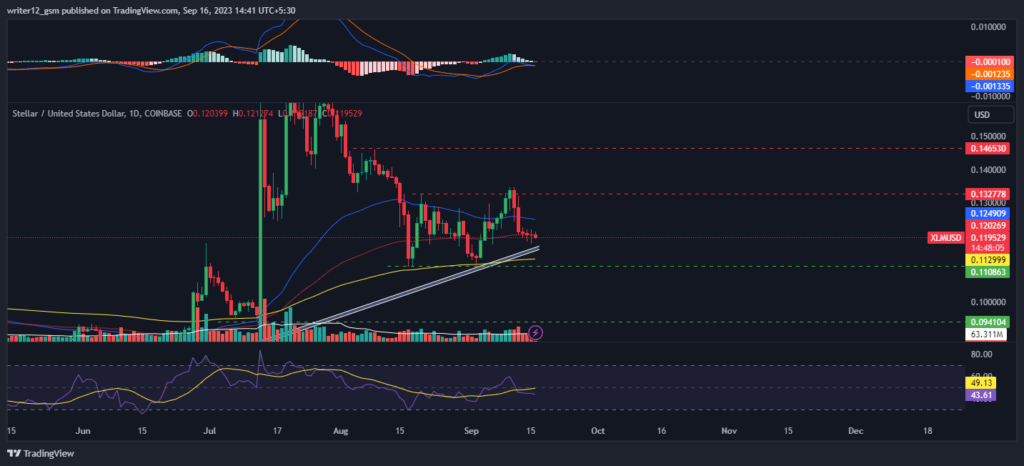
At the time of publishing, Stellar crypto (USD: XLM) was trading below the 50 and 100-day SMAs (simple moving averages), which do not support the price trend.
However, if selling volume adds up, then the price might conquer supporting SMAs by making lower highs and lows. Hence, the XLM price is expected to move downwards giving bearish views over the daily time frame chart.
The current value of RSI is 40 points. The 14 SMA is above the median line at 49 points which indicates that the Stellar crypto is bearish. The MACD line at -0.001332 and the signal line at -0.001235 are below the zero line. A bearish crossover is observed in the MACD signaling more bearishness for the XLM crypto price.
Summary
Stellar (USD: XLM) technical oscillators also support the bearish trend. The MACD, RSI, and EMA are emphasizing negative signs and imply that the downtrend may continue in the XLM crypto price. Stellar price action suggests that the investors and traders are bearish on the 1-D time frame. The price action reflects a bearish perspective at the moment.
Technical Levels
- Support Levels: $0.098853 and $0.082826.
- Resistance Levels: $0.126826 and $0.142853.
Disclaimer
This article is for informational purposes only and does not provide any financial, investment, or other advice. The author or any people mentioned in this article are not responsible for any financial loss that may occur from investing in or trading. Please do your own research before making any financial decisions

Andrew is a blockchain developer who developed his interest in cryptocurrencies while pursuing his post-graduation major in blockchain development. He is a keen observer of details and shares his passion for writing, along with coding. His backend knowledge about blockchain helps him give a unique perspective to his writing skills, and a reliable craft at explaining the concepts such as blockchain programming, languages and token minting. He also frequently shares technical details and performance indicators of ICOs and IDOs.


