
 Home
Home News
News

- 1 SUI crypto price is facing headwinds, continues to lose gains.
- 2 Bears are showing their strength and pushing SUI back to its home.
SUI crypto price is still hovering in a downtrend, and buyers failed to hold the gains and have been facing headwinds created by the mighty bears over the past weeks. Moreover, the SUI price is near its lower trendline, which, if it breaks, it would head for $0.0950. However, the sellers persisted in adding short positions, looked aggressive for the past sessions. Furthermore, the chart structure of SUI shows that bears persisted in initiating follow-on selling, and bulls did not hold strength, resulting in a drawdown of SUI crypto price.
SUI crypto is forming a symmetrical triangle pattern, and the price is trading near the breakout zone. However, the primary hurdle is near the 100-day EMA at $0.05500, which needs to be surpassed to initiate a reversal. In contrast, the primary support is near $0.4000, which, if it breaks, it would redirect the SUI price toward the origin of $0.0950. Moreover, the chart suggests that follow-on selling will persist, and that the price may retest its lows soon.

At press time, SUI crypto price is trading at $0.4554 with an intraday gain of 2.06%, showing neutrality on the charts. Moreover, the trading volume increased by 18.51% to $80.60 Million. The pair of SUI/BTC is at 0.000173 BTC. However, the market cap of SUI crypto is $242.81 Million. Moreover, analysts maintained a sell rating and suggested a significant downside for the following sessions.
SUI Price Action on Daily Charts
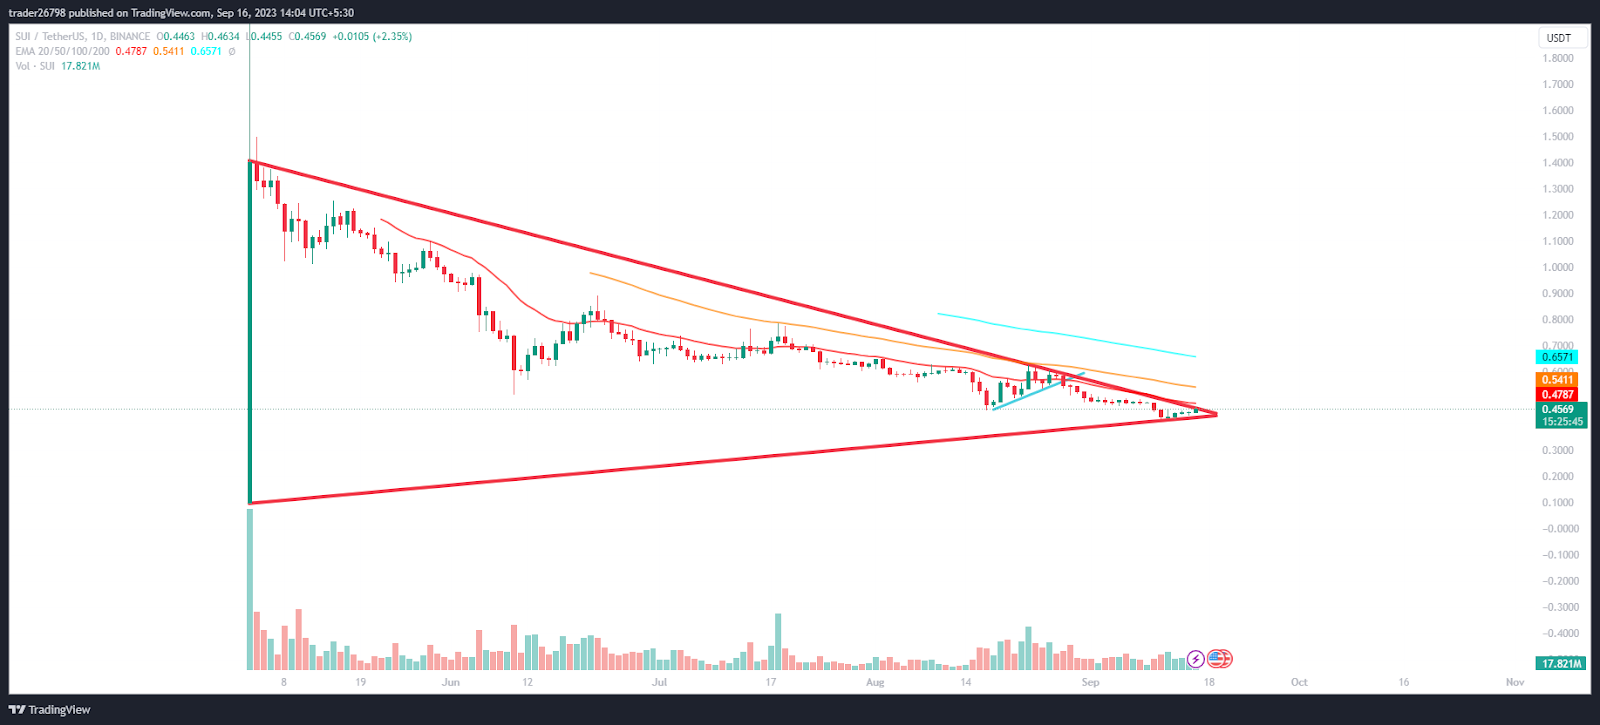
On the daily charts, the SUI crypto price has retraced more than 50% from the top, and the Fib cluster shows that the price is near the 23.6% Fib zone, suggesting a rebound now. Moreover, the price is at a make-or-break level near the trendline of the symmetrical triangle pattern. If the price sustains near $0.4500, a rebound toward $0.4800 followed by $0.5000 can be anticipated. However, the bulls are now challenged and need more strength to initiate a pullback due to aggressive short buildups.
Short Term Chart Shows Seller Dominance
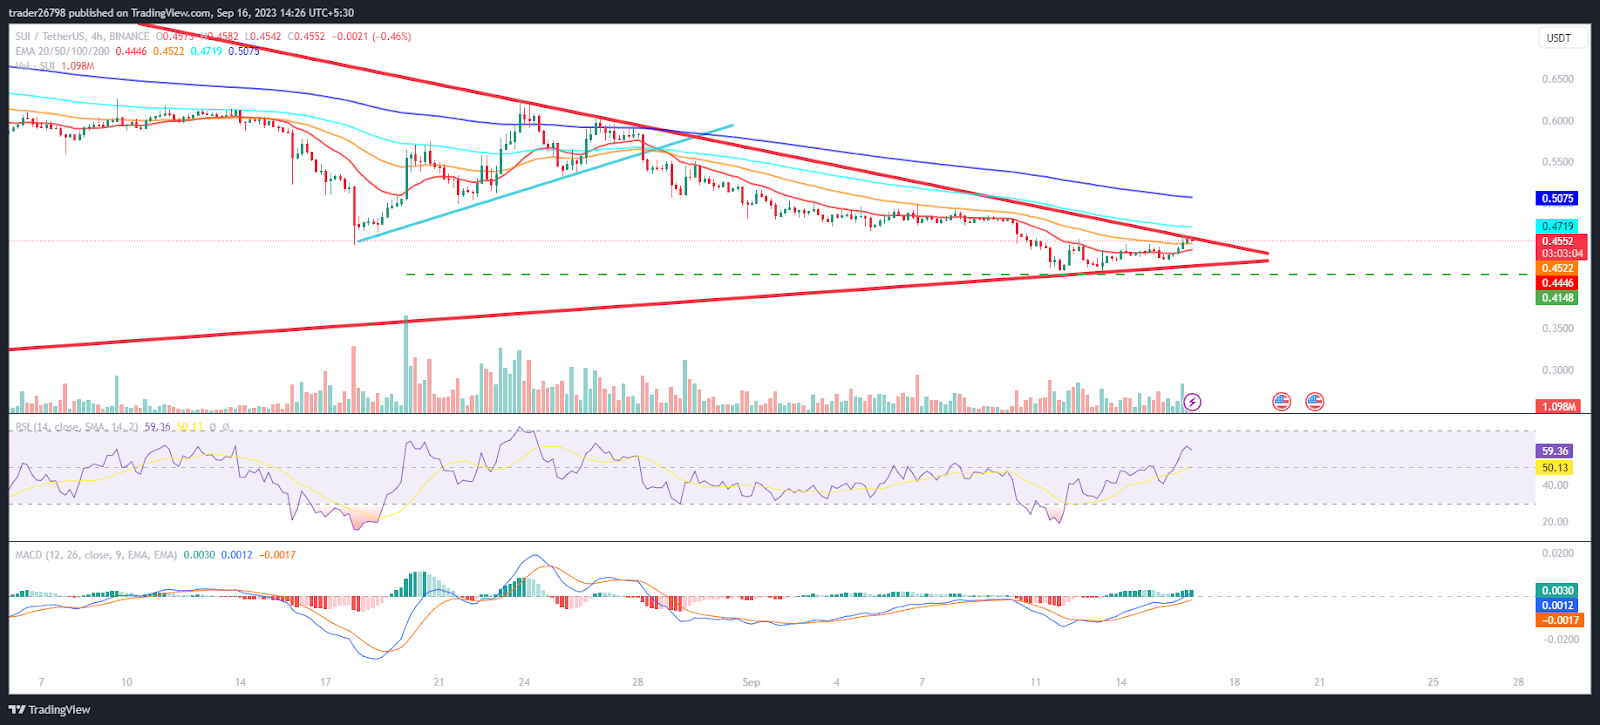
On the 4-hour charts, SUI crypto price rebounded from the lower trendline and is attempting to surpass the upper trendline near $0.4600, showcasing buyers’ efforts to retain the 200-day EMA.
The RSI curve shows a sharp move, flowing in the overbought zone, indicating a bullish divergence and a positive outlook for the following sessions.
The MACD indicator showed a bullish crossover, forming green bars on the histogram, suggesting a significant reversal toward the 200-day EMA.
Summary
SUI crypto price showcased a symmetrical triangle pattern and is close to the upper trendline near $0.4600, which, if surpassed, would lead to a shift in the bulls’ momentum, and SUI will gain traction to retest the 200-day EMA. Moreover, the price action suggests a reversal that the bulls can soon attain. However, bulls need to attain further strength for a pullback, otherwise it will lead to a rapid fall toward $0.4000
Technical Levels
Support Levels: $0.4400 and $0.4200
Resistance Levels: $0.5000 and $0.5200
Disclaimer
The views and opinions stated by the author or any other person named in this article are for informational purposes only and do not constitute financial, investment, or other advice. Investing in or trading crypto or stocks comes with a risk of financial loss.
Steve Anderson is an Australian crypto enthusiast. He is a specialist in management and trading for over 5 years. Steve has worked as a crypto trader, he loves learning about decentralisation, understanding the true potential of the blockchain.


