
 Home
Home News
News
- 1 EXPN stock price: The annual report showed a rise in revenue, attracting investors.
- 2 The RSI and MACD are highlighting the bulls’ strength.
Experian Plc. is listed on the London Stock Exchange. It is a global information services company which facilitates the provision of data and analytical tools that are used to manage credit risk, prevent fraud, target marketing offers, and automate decision-making. The company was founded in 1980 and is headquartered in Dublin, Ireland.
The Tech giant is a large-cap stock with a market capitalization of £25.6 Billion. In the financial year 2023, the company clocked in £5.50 Billion in revenue which is a 19% growth from the last year. Net profit was £639 Million which is 13% of the sales.

Recurring net income over the years has allowed the firm to pull out regular dividends to its shareholders. In 2023, the management decided to give a dividend payout of 62%. That made up a dividend per share of £0.44 and a dividend yield of 1.64%
Technical Analysis and Price Prediction of EXPN Stock
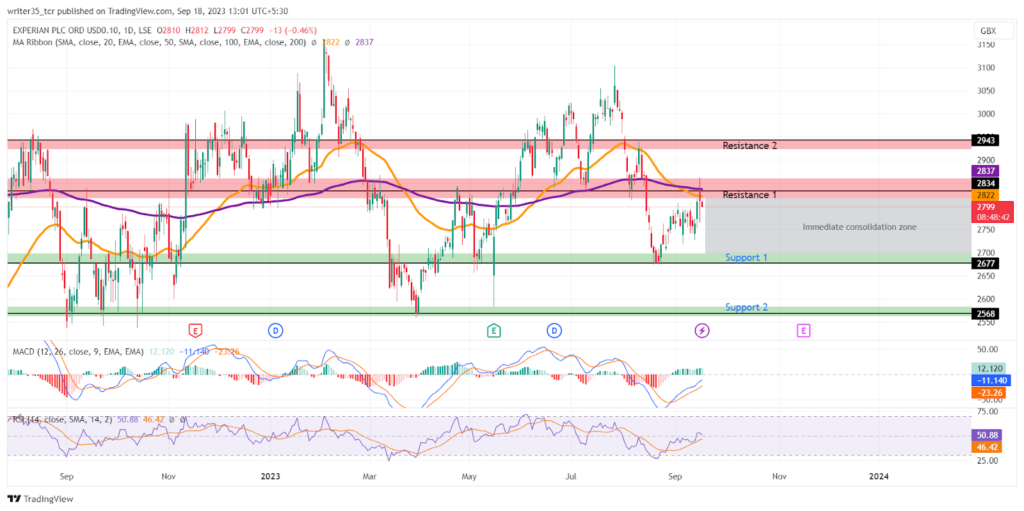
XPN stock price started rising after the annual report of 2023 which was published in May this year The bulls took the price from £2583 to a high of £3102 in July. After that, the stock saw some correction and went on to break two major support levels.
As of now, EXPEN stock price is trading at £2807, which is in the immediate resistance zone of £2834. The bulls pushed the price up, reclaiming the immediate support level of £2677. Currently, the bullish investors are trying hard to break out and overcome the present resistance level
Indicators Highlight Bullish Strength
A bullish crossover occurred between MACD and its EMA late August which indicates an uptrend alongside the support and resistance levels. At present, the MACD is at the level of -11 while its EMA is beneath -23
The RSI on the other hand rebounded from the oversold level of 30 mid-August when the stock price reclaimed its support level. After a few days, the RSI made a bullish crossover with its SMA.
The EMAs, on the other hand, are showing a downtrend as a result of a bearish crossover that was made between them mid-August this year. This was the time when the bears broke the major support levels. At present, the 50 days EMA is at the level of £2782 while the 200 EMA is at £2833
Conclusion
The EXPN price prediction is bearish as red candles were observed recently. However, a glimmer of hope is down below at the name of 50 days EMA.
Technical Levels
Support levels: £2677 and £2568
Resistance levels: £2834 and £2943
Disclaimer
The views and opinions stated by the author, or any people named in this article, are for informational purposes only. They do not establish financial, investment, or other advice. Investing in or trading crypto assets or stocks comes with a risk of financial loss.

Andrew is a blockchain developer who developed his interest in cryptocurrencies while pursuing his post-graduation major in blockchain development. He is a keen observer of details and shares his passion for writing, along with coding. His backend knowledge about blockchain helps him give a unique perspective to his writing skills, and a reliable craft at explaining the concepts such as blockchain programming, languages and token minting. He also frequently shares technical details and performance indicators of ICOs and IDOs.


