
 Home
Home News
News
- 1 Pepe price prediction suggests that the bears are dominating the trend.
- 2 Pepe (PEPE) price is down by 3.34% in the last 24 hours and it currently trades at $0.00000064.
The Pepe price prediction illustrates that the Pepe price has been making candlestick patterns like doji and spinning tops after a drop, which signals a weakening of the buyers that caused the breakdown of the recent support and the price declined to a lower level.
The daily chart reveals that the PEPE price has been on a steady decline for the last 6 months, erasing the profits and falling further. The buyers’ efforts were turned into pullbacks each time and this made the price suffer a continuous slump.
The PEPE crypto price plunged nearly 36% in August 2023, hitting the lower boundary of a channel pattern formed on the daily chart. Lately, the PEPE crypto has made a new swing low after breaking below the previous one.
Pepe Price Prediction Using Price Action Strategy
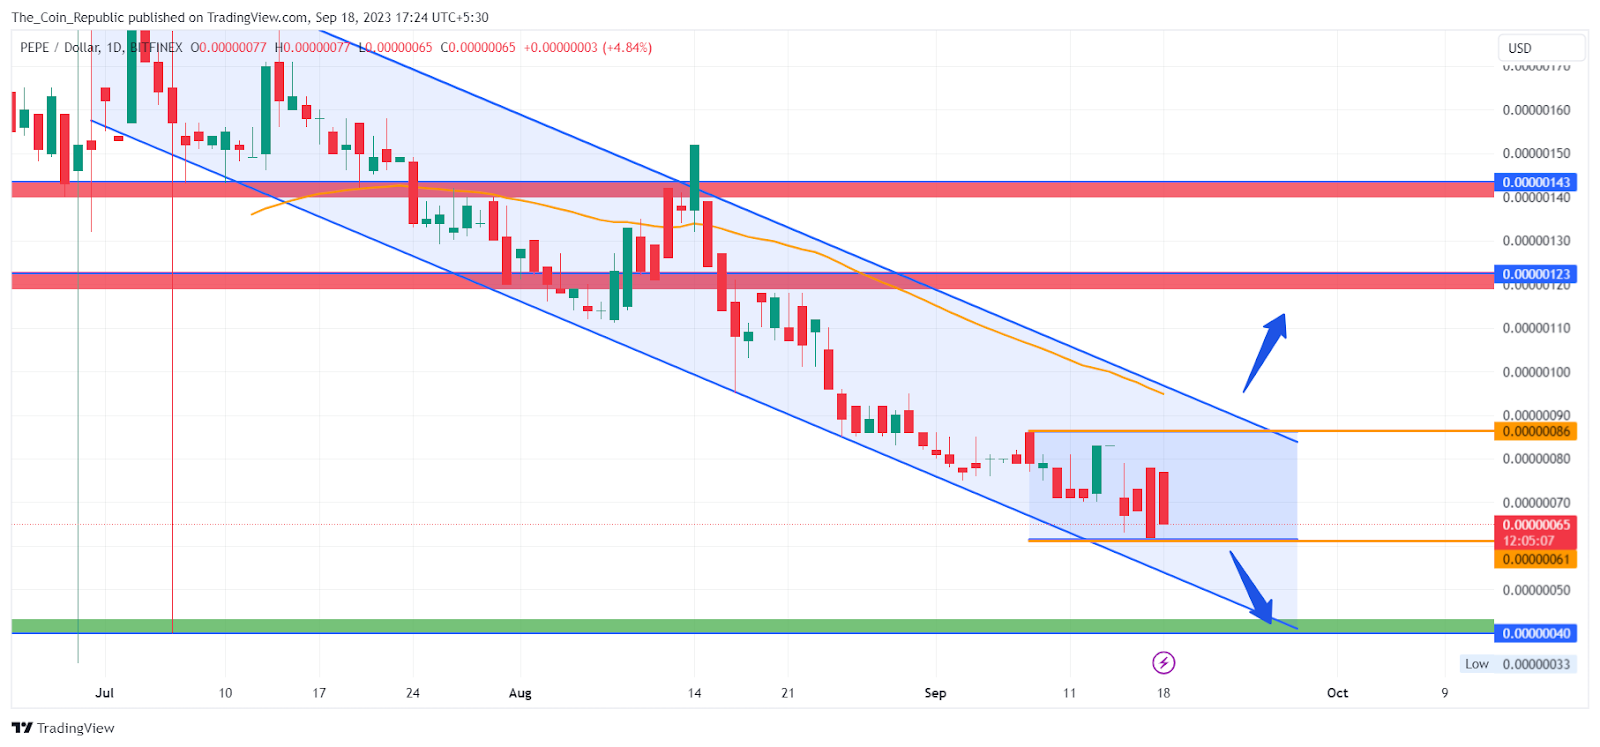
The PEPE price currently trades at $0.00000064 and made a breakdown of the recent support to slide at the lower level.
The price is again showing a consolidation after the breakdown at the lower levels and showing no signs of recovery till now. The Pepe price might resume its decline if it breaks below the consolidation.
The volume analysis shows that the Pepe crypto has received $57.18 Million volume in the past 24 hours with a gain of 121.21% from the past day. The volume-to-market cap is 22.2% which indicates high volatility in the crypto. The crypto holds a market cap of $252.36 Million with a decline of 3.09% in the last 24 hours.
PEPE Price Forecast From Indicators’ Point of View
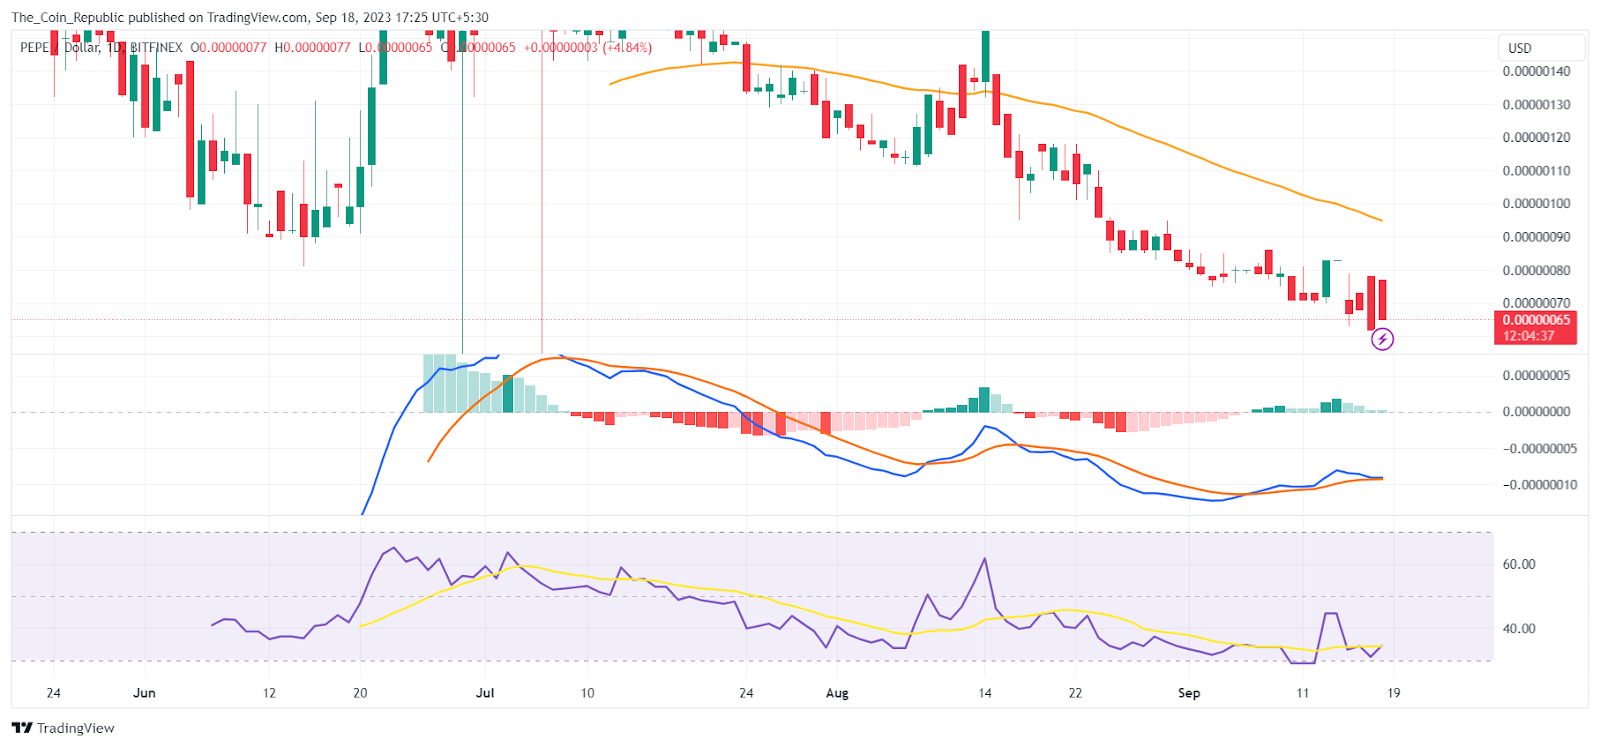
As per the EMA analysis, the PEPE price has dropped below the 50-day and 200-day EMA indicating a bearish trend in the crypto. The price might suffer rejection from the EMAs if surges higher.
The relative strength index (RSI) line is currently trying to recover after entering the oversold level, positioned below the 14-day SMA. This suggests a bearish crossover with the 14-day SMA, indicating weakness in the price of PEPE in the near future. The present value of stochastic RSI is 34.04 points whereas the 14-day SMA is moving around 32.6 points.
Conclusion
PEPE price prediction shows that the Pepe price has been declining for the last 6 months, making candlestick patterns that indicate a loss of buyers’ strength. The price broke below the recent support and hit the lower edge of a channel pattern on the daily chart. The price is consolidating at the lower levels with no signs of recovery. The volume is high and volatile, indicating a possible further drop. The crypto has a market cap of $252.36 Million and trades at $0.00000064.
Technical Levels
- Support levels: $0.00000065 and $0.00000041.
- Resistance levels: $0.00000086 and $0.00000123.
Disclaimer
The views and opinions stated by the author, or any people named in this article, are for informational purposes only and do not establish financial, investment, or other advice. Investing in or trading crypto or stock comes with a risk of financial loss.

Adarsh Singh is a true connoisseur of Defi and Blockchain technologies, who left his job at a “Big 4” multinational finance firm to pursue crypto and NFT trading full-time. He has a strong background in finance, with MBA from a prestigious B-school. He delves deep into these innovative fields, unraveling their intricacies. Uncovering hidden gems, be it coins, tokens or NFTs, is his expertise. NFTs drive deep interest for him, and his creative analysis of NFTs opens up engaging narratives. He strives to bring decentralized digital assets accessible to the masses.


