
 Home
Home News
News

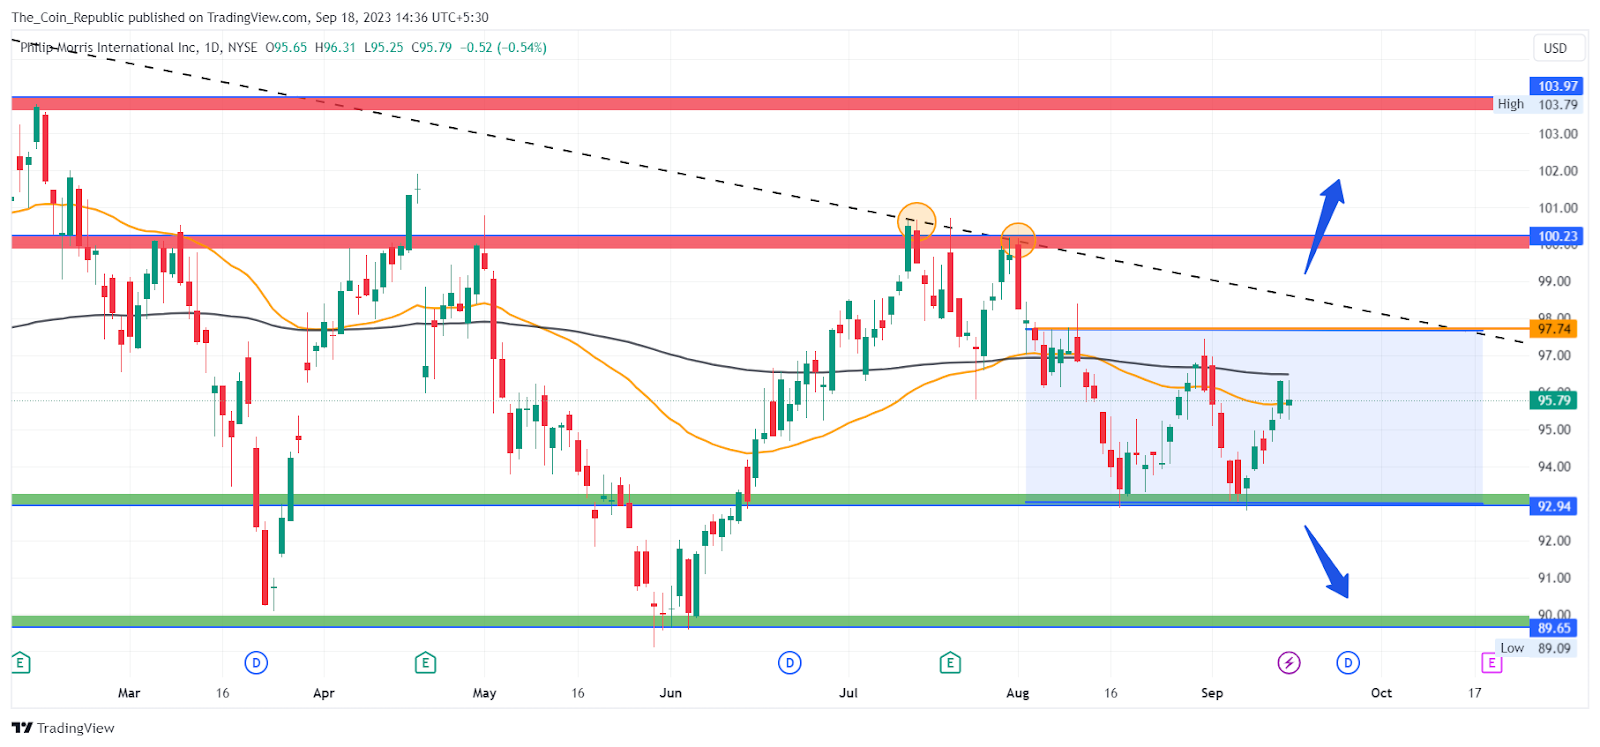
- 1 Philip Morris International Inc. (NYSE: PM) stock price gained 2.66% in the last week and currently trades at $95.79.
- 2 PM stock price is struggling to surge above the key exponential moving average of 50 and 200-day EMA.
- 3 The daily chart shows that the stock price has suffered multiple rejections from an upper trendline resistance.
The price analysis of Philip Morris International Inc. (PM) stock illustrates that the stock price is showing a volatile trend on the charts maintaining a 10% range. The stock price is struggling to escape the range of $90 to $100.
The daily chart shows that the stock price is trying to reduce its volatile range and form a descending triangle pattern over the daily timeframe. Bulls have firmly established their control near the round level of $90 while the bears are dominating near an upper trendline resistance.
The technical indicators imply a sideways trend as the price and EMAs are showing a frequent crossover. The price may remain volatile and continue to contract its range of consolidation until either side dominates and creates an imbalance.

The analysts offering a price projection for 1-year have a bullish outlook. The analysts observe a potential of 35% which could take the price to a high of $130. On the other hand, the bearish outlook stands at a drawdown of 9.18% from CMP which could drag the price to a low of $87.
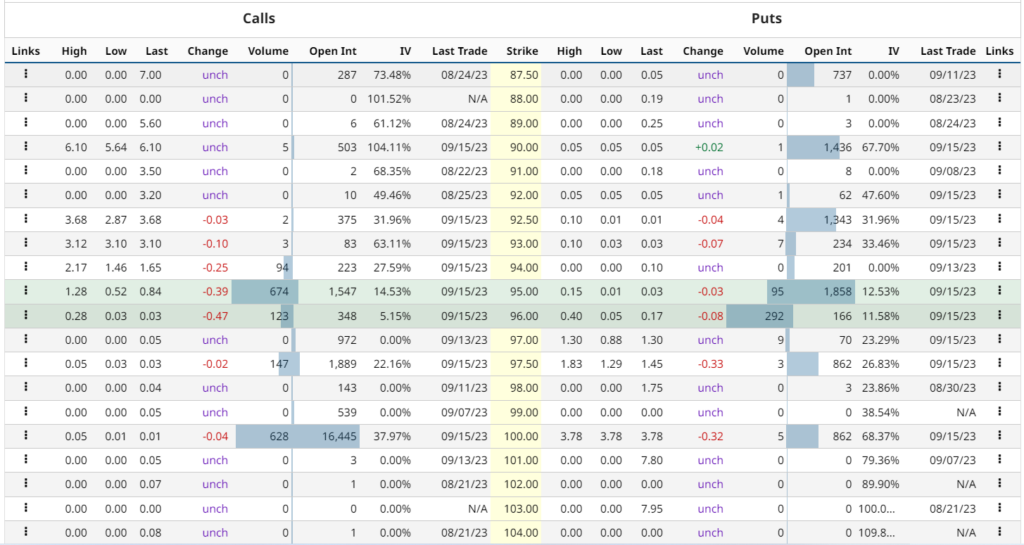
PM stock option-chain analysis states that the current implied volatility in the market is 18.17% with an increment of 1.17% in the last trading session. The at-the-money strike price has 1858 open contracts on the PUT side and 1547 open contracts on the CALL side indicating the dominance of buyers at the current level.
Philip Morris International Stock Price Shows a Sideways Trend
The PM stock price currently trades at $95.79 with a decline of 0.54% in intraday on Friday. The price shows volatility over the daily chart and struggles to break above the exponential moving average of 50 and 200 EMA.
Analysts are indecisive over a clear trend as the price has a volatile range of 10% which is contracting as of now. Currently, the price trend may remain sideways until it trades in the range.
The breakout above the upper trendline resistance may hike the price to surge above the $100 level. On the other hand, the breakdown of the support may turn the short-term trend bearish and the price may decline to the lower levels.
RSI And MACD Indicators Show Volatility and Indecisive Trend

The technical indicators opinion rating including RSI and MACD for the stock indicates a 40% “sell” with a weakest short-term outlook on maintaining the current trend.
Conclusion
PM stock price currently trades at $95.79 with a 2.66% gain in the last week. The stock has been volatile over the charts and contracting its rage of trading. The price currently trades in a 10% range and might remain volatile and indecisive until the range contacts. The breakout or breakdown of the descending triangle pattern may further decide the trend.
Technical Levels
- Support levels: $92.94 and $89.65
- Resistance levels: $100.23 and $103.97
Disclaimer
The views and opinions stated by the author, or any people named in this article, are for informational purposes only and do not establish financial, investment, or other advice. Investing in or trading crypto or stock comes with a risk of financial loss.

Andrew is a blockchain developer who developed his interest in cryptocurrencies while pursuing his post-graduation major in blockchain development. He is a keen observer of details and shares his passion for writing, along with coding. His backend knowledge about blockchain helps him give a unique perspective to his writing skills, and a reliable craft at explaining the concepts such as blockchain programming, languages and token minting. He also frequently shares technical details and performance indicators of ICOs and IDOs.


