
 Home
Home News
News
- 1 MINA Crypto price is struggling to sustain above 50 EMA.
- 2 MINA price is trading at $0.384 with a trading volume of 6.598K (press time).
The price action of the MINA crypto showed that selling pressure was noted on the charts and was in a downtrend, forming lower lows over the past few months. Moreover, due to declining investor interest, trading volume was below average.
Furthermore, MINA showed a decline in user activity which also reacted as a negative sentiment for the crypto and led to bearishness in the charts.
MINA is trading below the significant moving averages and tried to attain the 50-day EMA to hold the gains.
At the time of writing, the MINA price is trading at $0.384 with an intraday gain of 1.05%, showing a bounce from the lower trendline. Moreover, the intraday trading volume is $6.982K and the market cap is $374.555 Million.
Year-to-date, it gave negative returns of -11.06%; and -52.05% in a span of 6 months. In the last 1 month, it gave a negative return of -7.43% and a positive return of 5.18% in the last seven days highlighting a bearish trend.
Technical Analysis of MINA Crypto Price in 1-D Timeframe
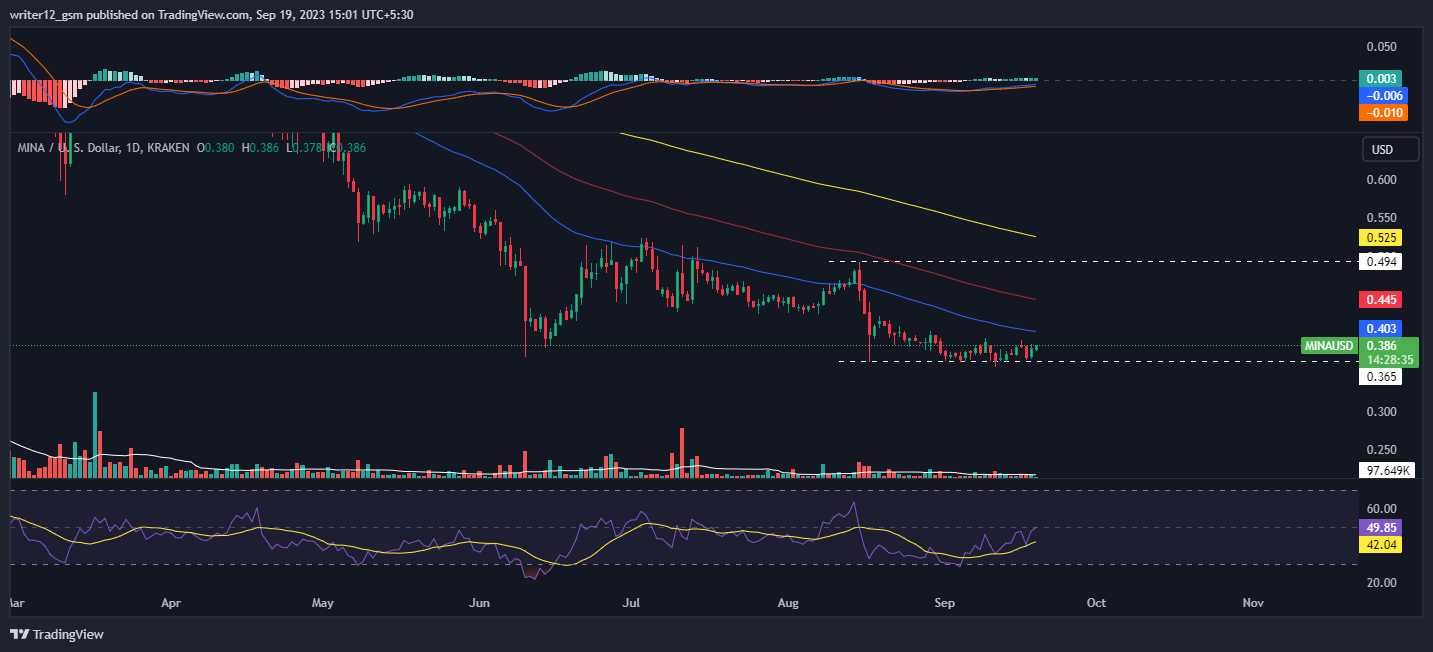
At the time of publishing, MINA crypto is trading below the 50 and 200-day SMAs (simple moving averages), which are not supporting the price trend.
The current value of RSI is 49.85 points. The 14 SMA is above the median line at 42.04 points which indicates that the MINA crypto is bearish.
The MACD line at -0.006 and the signal line at -0.010 are heading towards the zero line. A bullish crossover is observed in the MACD indicator which signals more bearishness for the MINAUSD crypto price.
4 Hour Time Frame Technical Evaluation
On the 4-hour charts, the MINA price is stuck in a narrow range and does not signal a rise because of low volume levels.
The RSI curve is near 58, in the neutral range, and showed a narrow consolidation move on the short-term charts.
The MACD indicator still showed green bars on the histogram with a bullish crossover but did not signal any substantial upswing.
Summary
MINA (MINAUSD) technical oscillators also support the bearish trend. The MACD, RSI, and EMA are emphasizing negative signs and imply that the downtrend may continue in the MINAUSD crypto price. MINA price action suggests that the investors and traders are bearish on the 1-D time frame. The price action reflects a bearish perspective at the moment.
Technical Levels
- Support Levels: $0.328 and $0.281.
- Resistance Levels: $0.458 and $0.541.
Disclaimer
This article is for informational purposes only and does not provide any financial, investment, or other advice. The author or any people mentioned in this article are not responsible for any financial loss that may occur from investing in or trading. Please do your own research before making any financial decisions

With a background in journalism, Ritika Sharma has worked with many reputed media firms focusing on general news such as politics and crime. She joined The Coin Republic as a reporter for crypto, and found a great passion for cryptocurrency, Web3, NFTs and other digital assets. She spends a lot of time researching and delving deeper into these concepts around the clock, and is a strong advocate for women in STEM.


