
 Home
Home News
News
- 1 NVDA stock price decreased by 4.73% over the past week and the current price is below all major EMA’s.
- 2 Nvidia Corporation (NASDAQ: NVDA) stock’s 52-week price range is $108 – $502.
Nvidia Corporation (NVDA) stock’s market capitalization is $1.086 Trillion and the total shares float is $2.37 Billion. Moreover, the stock’s basic EPS is $4.18 and the price-to-earnings ratio is 106.05.

Nvidia Corporation (NVDA) experienced an incline in its earnings at a rate of 19.3% per year on average, according to Simply Wall St., a financial website. The Semiconductor industry’s average annual earnings growth is 31.4%. Therefore, NVDA’s earnings are lower than the industry average.

Moreover, Nvidia Corporation stock performed well last month, increasing by 3.12% and by 66.38% in the last six months. Nvidia Corporation (NASDAQ: NVDA) stock has a positive year-to-date return of 196.05% and a one-year return of 245.06%. The average volume is 58.904 Million and the current volume is 50.005 Million where the current volume is below the 10-day aggregate volume.
The top shareholder of the company is The Vanguard Group Inc. which owns 8.05% of the company with a share count of 201,392,728 and a current value of 88.5 Billion. As per the recent insider transactions, an individual named Mark Stevens who is a member of the board of directors recently sold 52,175 hefty shares worth $76.7 Million on August 29, 2023.
NVDA Stock Price Technical Analysis in 1-D Timeframe
The price action shows that Nvidia Corporation (NASDAQ: NVDA) stock price took rejection from its peak of around $502 and has been decreasing by making lower highs and lower lows.
At the time of writing, NVDA stock is trading at around $439 and around the major trendline support.
Therefore, if the NVDA price fails to sustain the current level and drops below the trendline and previous swing lows, then it may hit the nearest support levels of $403 and $372 on the chart.
However, if it maintains the current level and succeeds in its attempt to take support from the trendline, then NVDA prices could continue to move upward and reach the first and second technical resistances of $462 and $479. It can even shoot above the yearly peak and go for new peaks as well.
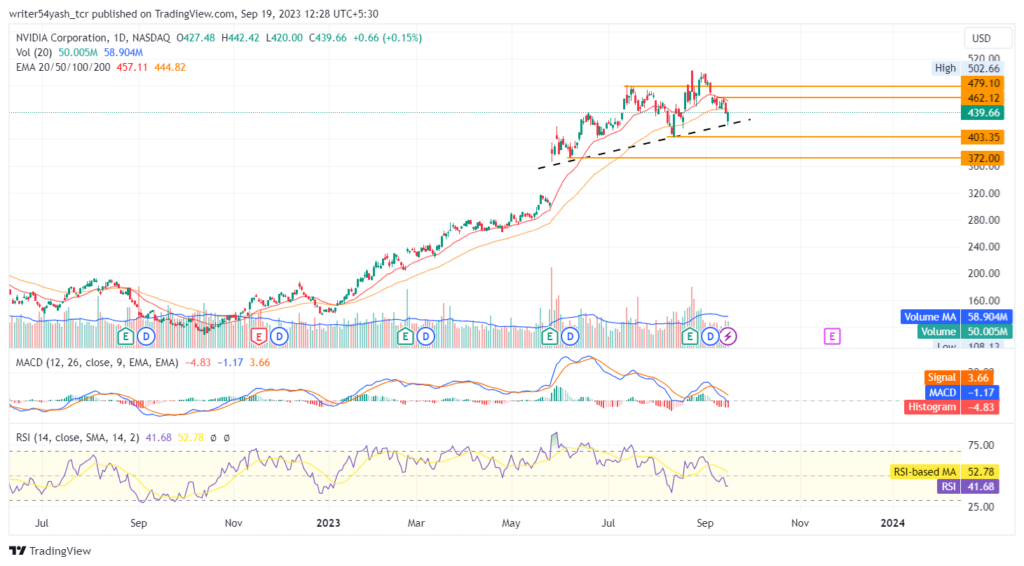
At the time of publishing, Nvidia Corporation (NASDAQ: NVDA) is trading below the major 20 and 50-day EMA (exponential moving averages).
The MACD line at 1.17 and signal line at 3.66 are below the zero line and both lines have crossed each other as a bearish cross is noticed.
The current value of RSI is 41 points. The 14 SMA is below the median line at 52 points which indicates that RSI faced resistance from 14 SMA.
Collectively, all indicators indicate bearishness as the activity on both sides is strong as it is near the major upward trendline. From the trendline, either the NVDA stock could go up or continue falling.
Summary
Nvidia Corporation (NASDAQ: NVDA) chart indicates that the traders and investors of the stock price are uncertain on the 1-D time frame. The price action shows positive outlooks on both sides. However, the technical indicators of the Nvidia stock price are bearish.
Technical Levels
- Support levels: $403 and $372
- Resistance levels: $462 and $479
Disclaimer
In this article, the views and opinions stated by the author, or any people named are for informational purposes only, and they don’t establish the investment, financial, or any other advice. Trading or investing in cryptocurrency assets comes with a risk of financial loss.

Nancy J. Allen is a crypto enthusiast, with a major in macroeconomics and minor in business statistics. She believes that cryptocurrencies inspire people to be their own banks, and step aside from traditional monetary exchange systems. She is also intrigued by blockchain technology and its functioning. She frequently researches, and posts content on the top altcoins, their theoretical working principles and technical price predictions.


