
 Home
Home News
News
- 1 Block stock price (NYSE: SQ) fell 13.62% in the current month.
- 2 SQ stock price brokedown $50 support and hit a 52-week low.
- 3 Square stock price is in a strong downtrend.
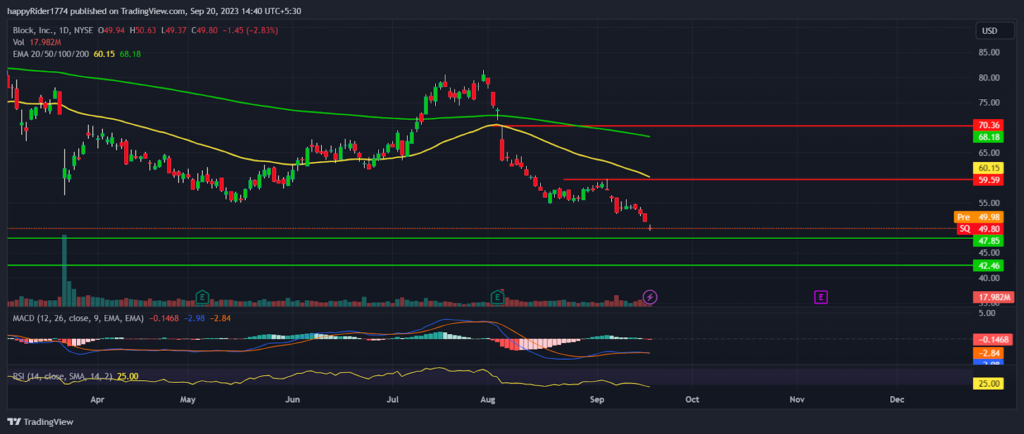
Block Inc. SQ stock price fell 13.62% in the current month and hit a 52-week low at $49.37. It formed a bearish pattern and eroded a big portion of the market capitalization.
SQ stock price faced rejection from $60.00 and prices began to decline by forming lower low candles. It shows that the sellers are active and continuing their dominance on the higher levels.
Block stock price is trading below the downward-sloping 50-day and 200-day EMA. It indicates the trend of the stock is in a downward direction. However, the current price has gone far from the EMA so a short-term bounce is possible to test the EMAs.
In August, Square stock price showed a steep fall and eroded the majority portion of the previous gain. In current months the sellers are getting active and dragging the prices further down.
Recently, SQ stock broke down the $50.00 support which triggered the negative sentiment. However, it will be interesting to see how SQ shares react which will decide the next direction.
Block stock price closed the previous session at $49.80 with an intraday decline of -2.83%.
Will SQ Stock Regain $60.00 by October End?
SQ stock price is in a correction phase and sellers look more active as compared to buyers. The chart pattern of the Square stock is highly bearish and no signs of recovery are visible.
On the lower side, the $42.00 to $48.00 range will act as a strong support for the bulls. If the price enters this zone then a downfall in the Block stock may take a halt.
On the higher side, $60.00 will act as an immediate hurdle for bulls. If the price recovers from the current levels then it may test $60.00.
Moreover, if genuine buyers become active and succeed in breaking the $60.00 hurdle then the short-term trend may reverse upward.
Block Stock Price Analysis
Block stock price is forming a bearish pattern on a daily, weekly, and monthly time frame. The sell-off on the last day looks scary and seems like some genuine investors had sold off from the higher levels.
The MACD curve in the SQ stock is sloping sideways indicating minor consolidation is possible before deciding further direction.
The RSI at 25 denotes weakness. But it is near the oversold territory so a pullback rally is possible to clear out the short positions.
Conclusion
Block Inc. SQ stock price fell 13.62% in the current month and eroded the majority portion of the previous gains. The analysis suggests the downfall in the Block stock price may take a halt near $48.00 and an upside reversal is possible.
Technical levels
- Resistance levels: $56.00 and $60.00
- Support levels: $47.00 and $42.00
Disclaimer
The views and opinions stated by the author, or any people named in this article, are for informational purposes only. They do not establish financial, investment, or other advice. Investing in or trading crypto assets comes with a risk of financial loss.

Adarsh Singh is a true connoisseur of Defi and Blockchain technologies, who left his job at a “Big 4” multinational finance firm to pursue crypto and NFT trading full-time. He has a strong background in finance, with MBA from a prestigious B-school. He delves deep into these innovative fields, unraveling their intricacies. Uncovering hidden gems, be it coins, tokens or NFTs, is his expertise. NFTs drive deep interest for him, and his creative analysis of NFTs opens up engaging narratives. He strives to bring decentralized digital assets accessible to the masses.


