
 Home
Home News
News
- 1 BP stock price is up by 0.67% in the last trading session and is currently trading at $38.82.
- 2 BP plc (NYSE: BP) stock price indicates bullishness and delivers a positive outlook.
- 3 BP stock price took support from the key moving average of 200-day EMA showing the participation of buying volume at the lower levels.
BP p.l.c. stock persists in an uptrend beyond the significant exponential averages and delivers bullish momentum. Moreover, the BP stock showed an upside rally after the bulls accumulated near the $35 level. The stock trades in the bullish territory.
The chart structure of BP stock showed that the stock has followed a rising parallel channel and is inclined to higher levels. The BP stock price showed some drawdowns which was absorbed by the buyers present at the lower levels and the price surged higher forming a lower high.

The daily chart defines that the price trend favors the buyers. The BP share price currently consolidates at the recent swing waiting to decide the trend further. The long-term is on the bullish side. However, the price may show a consolidation or drawdown in the short term.
The analysts offering a 1-year price forecast for BP stock has a maximum estimate of $74.80 with a potential of over 92% to the upside. It also has a maximum drawdown of 5.59% which could drag the price to the $36.65 level.
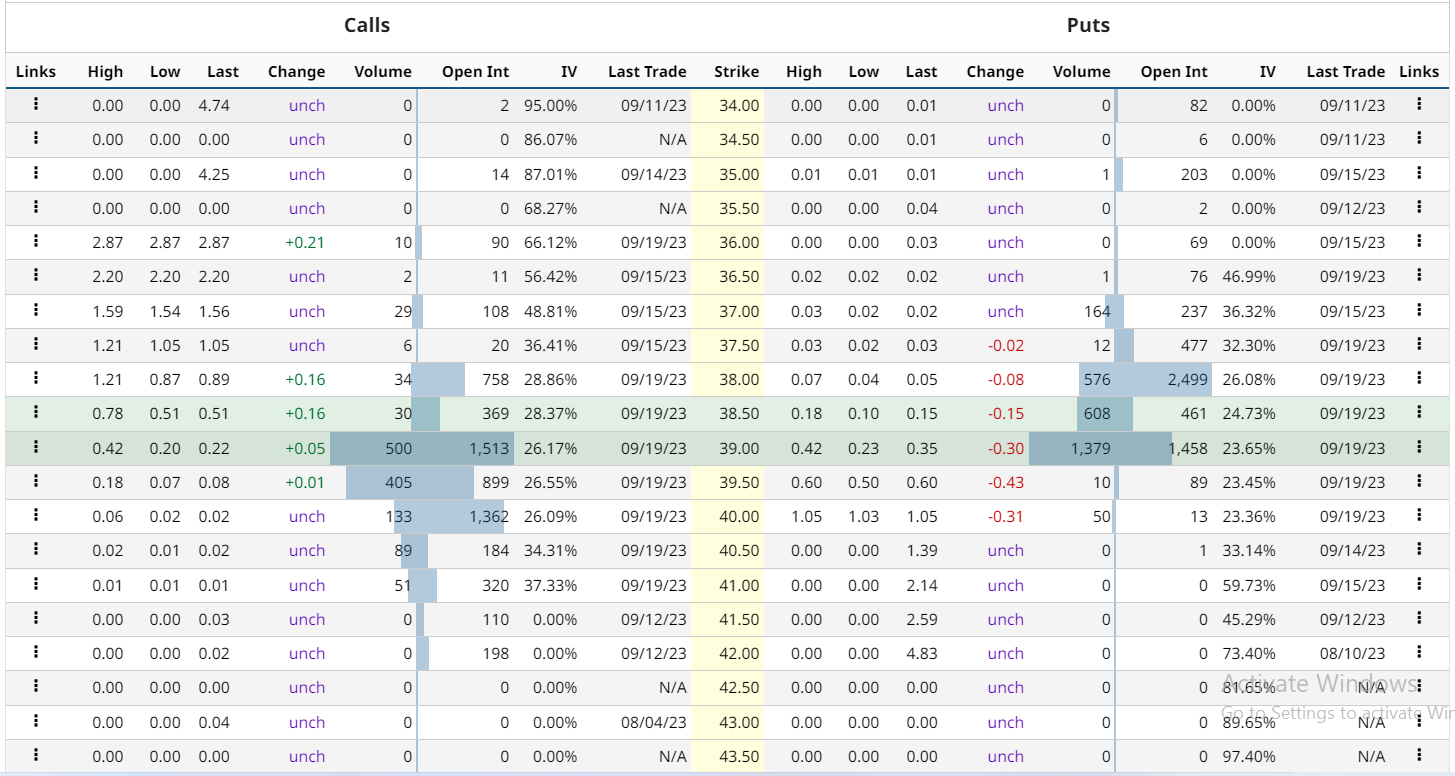
BP stock option-chain analysis states that the current implied volatility in the market is 19.76% with a decrement of 0.44% in the last trading session. The at-the-money strike price has 1513 open contracts on the PUT side and 1418 open contracts on the CALL side indicating the dominance of buyers at the current level.
BP Stock Price Consolidating Near the Top
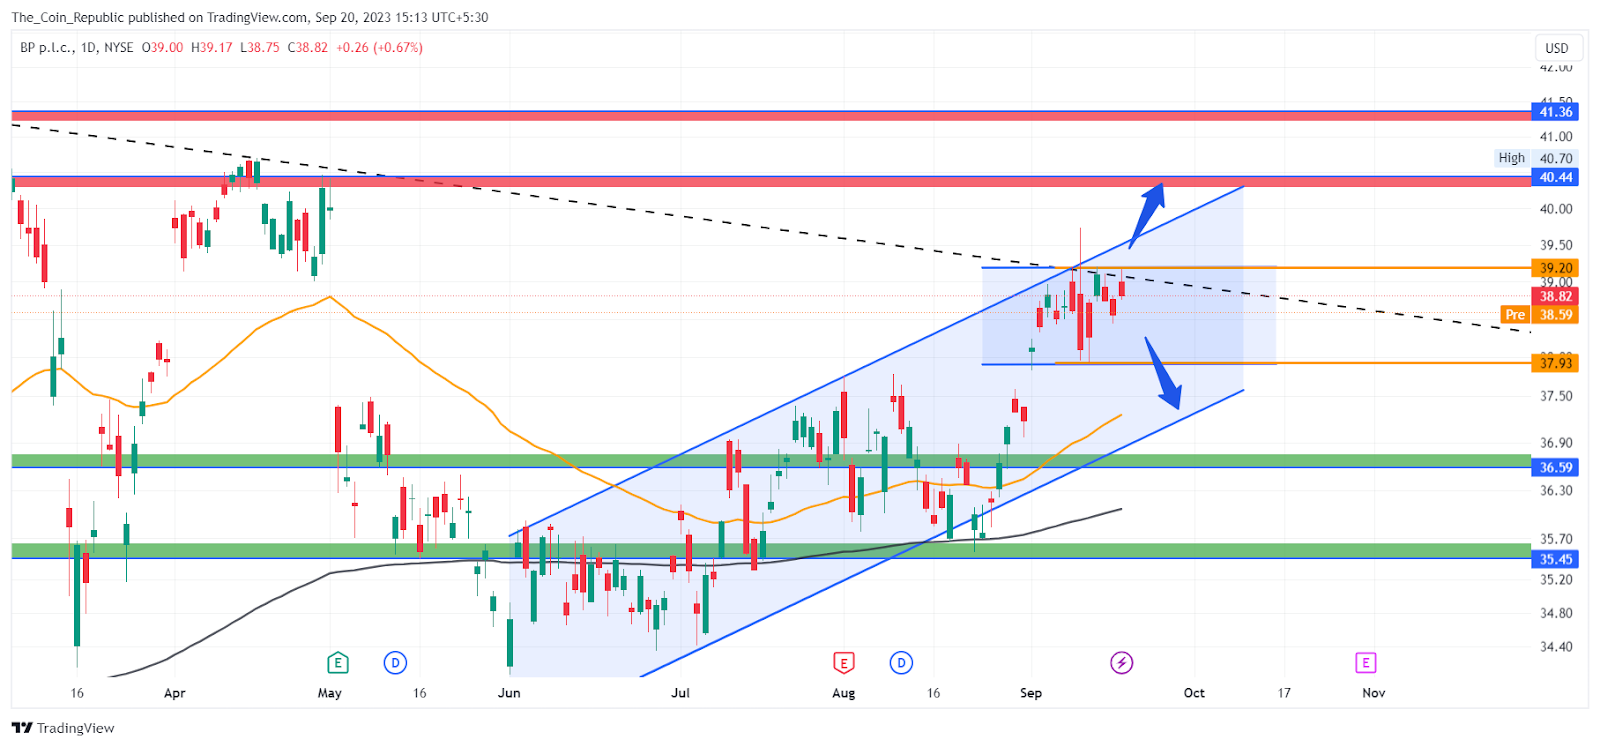
The BP stock price currently trades at $38.82 and it is consolidating at a higher level.
The BP share is showing strength over the charts. The price may remain under the control of buyers until it trades above the recent demand zone. Otherwise, the price may keep inclining at higher levels. The breakdown below the recent support may incur short-term bearishness in the stock.
EMAs Show Strength Over the Daily Chart
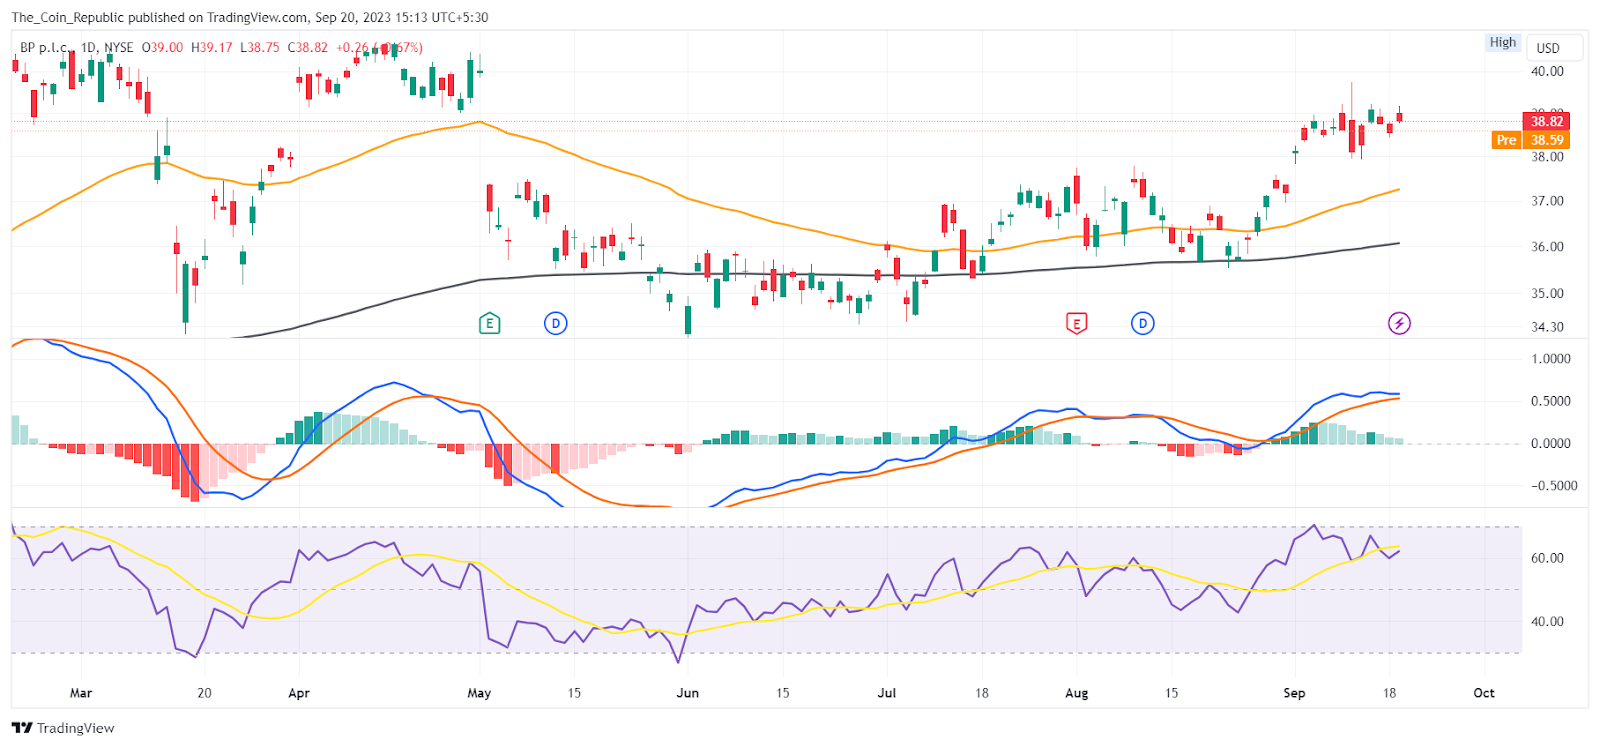
The daily BP stock price chart shows that the price is trading above 50 and 200-day EMA and surged higher after taking support indicating that the EMAs are acting as a dynamic support for the price.
The overall technical opinion rating including RSI and MACD is signaling a 72% “buy” rating with a strengthening short-term outlook on maintaining the current direction.
Conclusion
BP p.l.c. is a company that produces and sells oil and gas products. The BP stock price is in an uptrend and follows a rising channel pattern. The price consolidates at the recent high and may continue to rise or fall slightly. The analysts have a high estimate of $74.80 and a low estimate of $36.65 for the next year. The price is bullish in the long term but may face some resistance or support in the short term. The price is strong as long as it stays above the recent demand zone.
Technical Levels
- Support levels: $36.59 and $35.45
- Resistance levels: $39.20 and $40.44
Disclaimer
The views and opinions stated by the author, or any people named in this article, are for informational purposes only and do not establish financial, investment, or other advice. Investing in or trading crypto or stock comes with a risk of financial loss.

Nancy J. Allen is a crypto enthusiast, with a major in macroeconomics and minor in business statistics. She believes that cryptocurrencies inspire people to be their own banks, and step aside from traditional monetary exchange systems. She is also intrigued by blockchain technology and its functioning. She frequently researches, and posts content on the top altcoins, their theoretical working principles and technical price predictions.


